Show cards, charts, tables, maps and diagrams in chat
Add display power-ups so your bot can show information visually in the chat, for example a carousel of products, a revenue chart or a comparison table, instead of a long text reply.
Who can do this: team owners and admins.
Display power-ups don't fetch any data. The bot fills them with what it already has: the conversation, its knowledge and results from other power-ups. It then calls the display power-up to show that content.
Displays or display modes?
Display power-ups (this page) are separate power-ups the bot can choose to use for any content. A display mode is a setting on another power-up, such as API request, that always turns that power-up's result into a display. See Show a power-up's results visually.
The display power-ups
| Power-up | Best for | Setting |
|---|---|---|
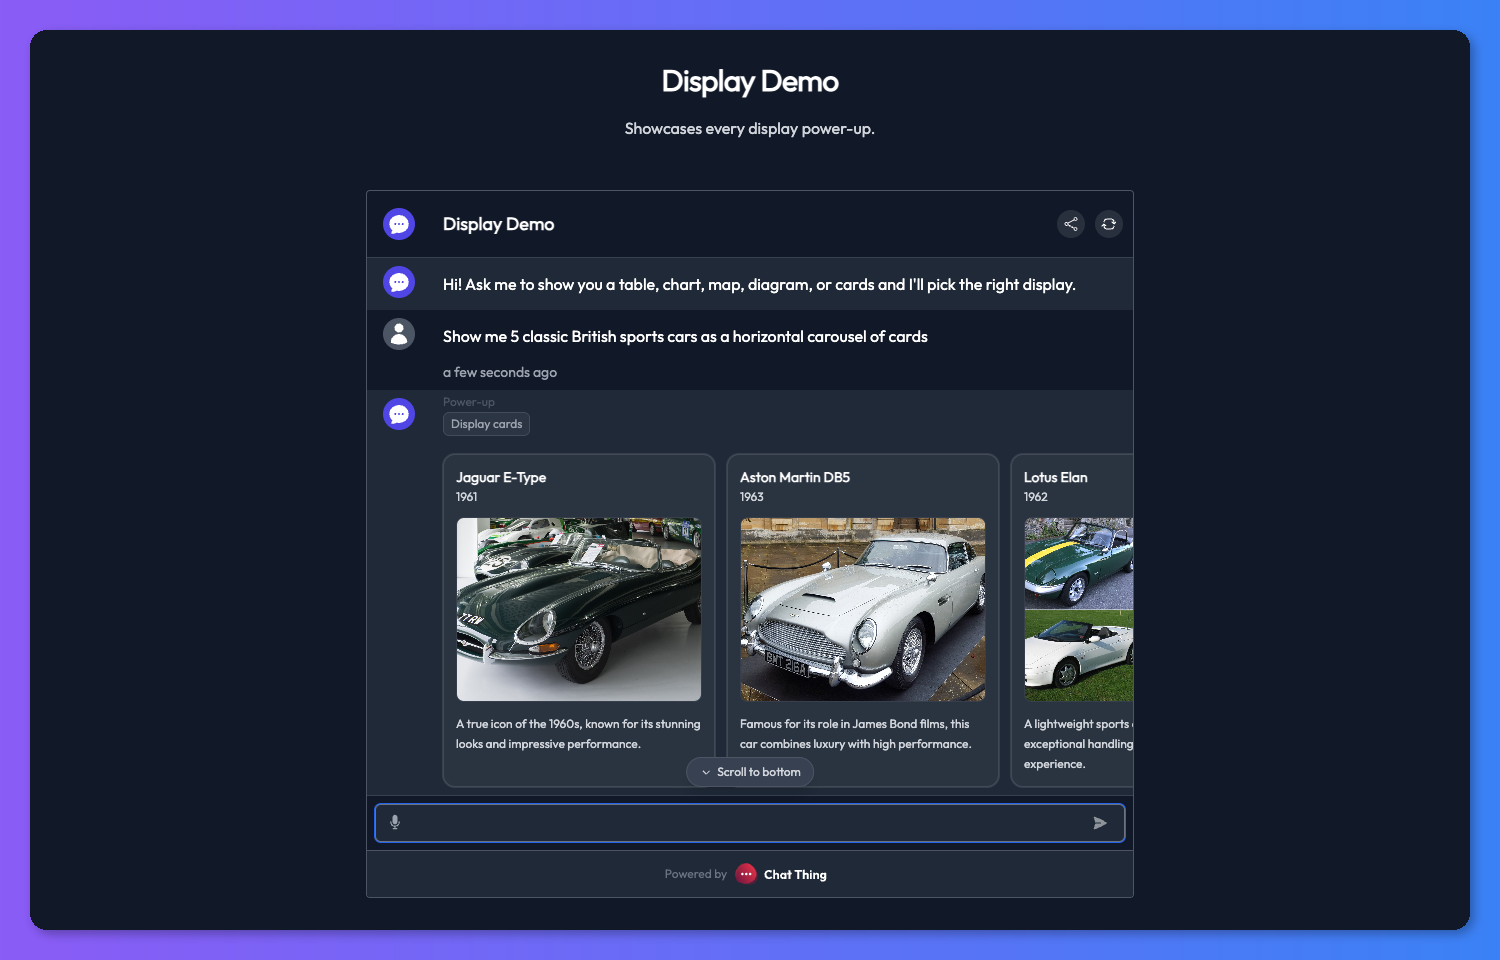
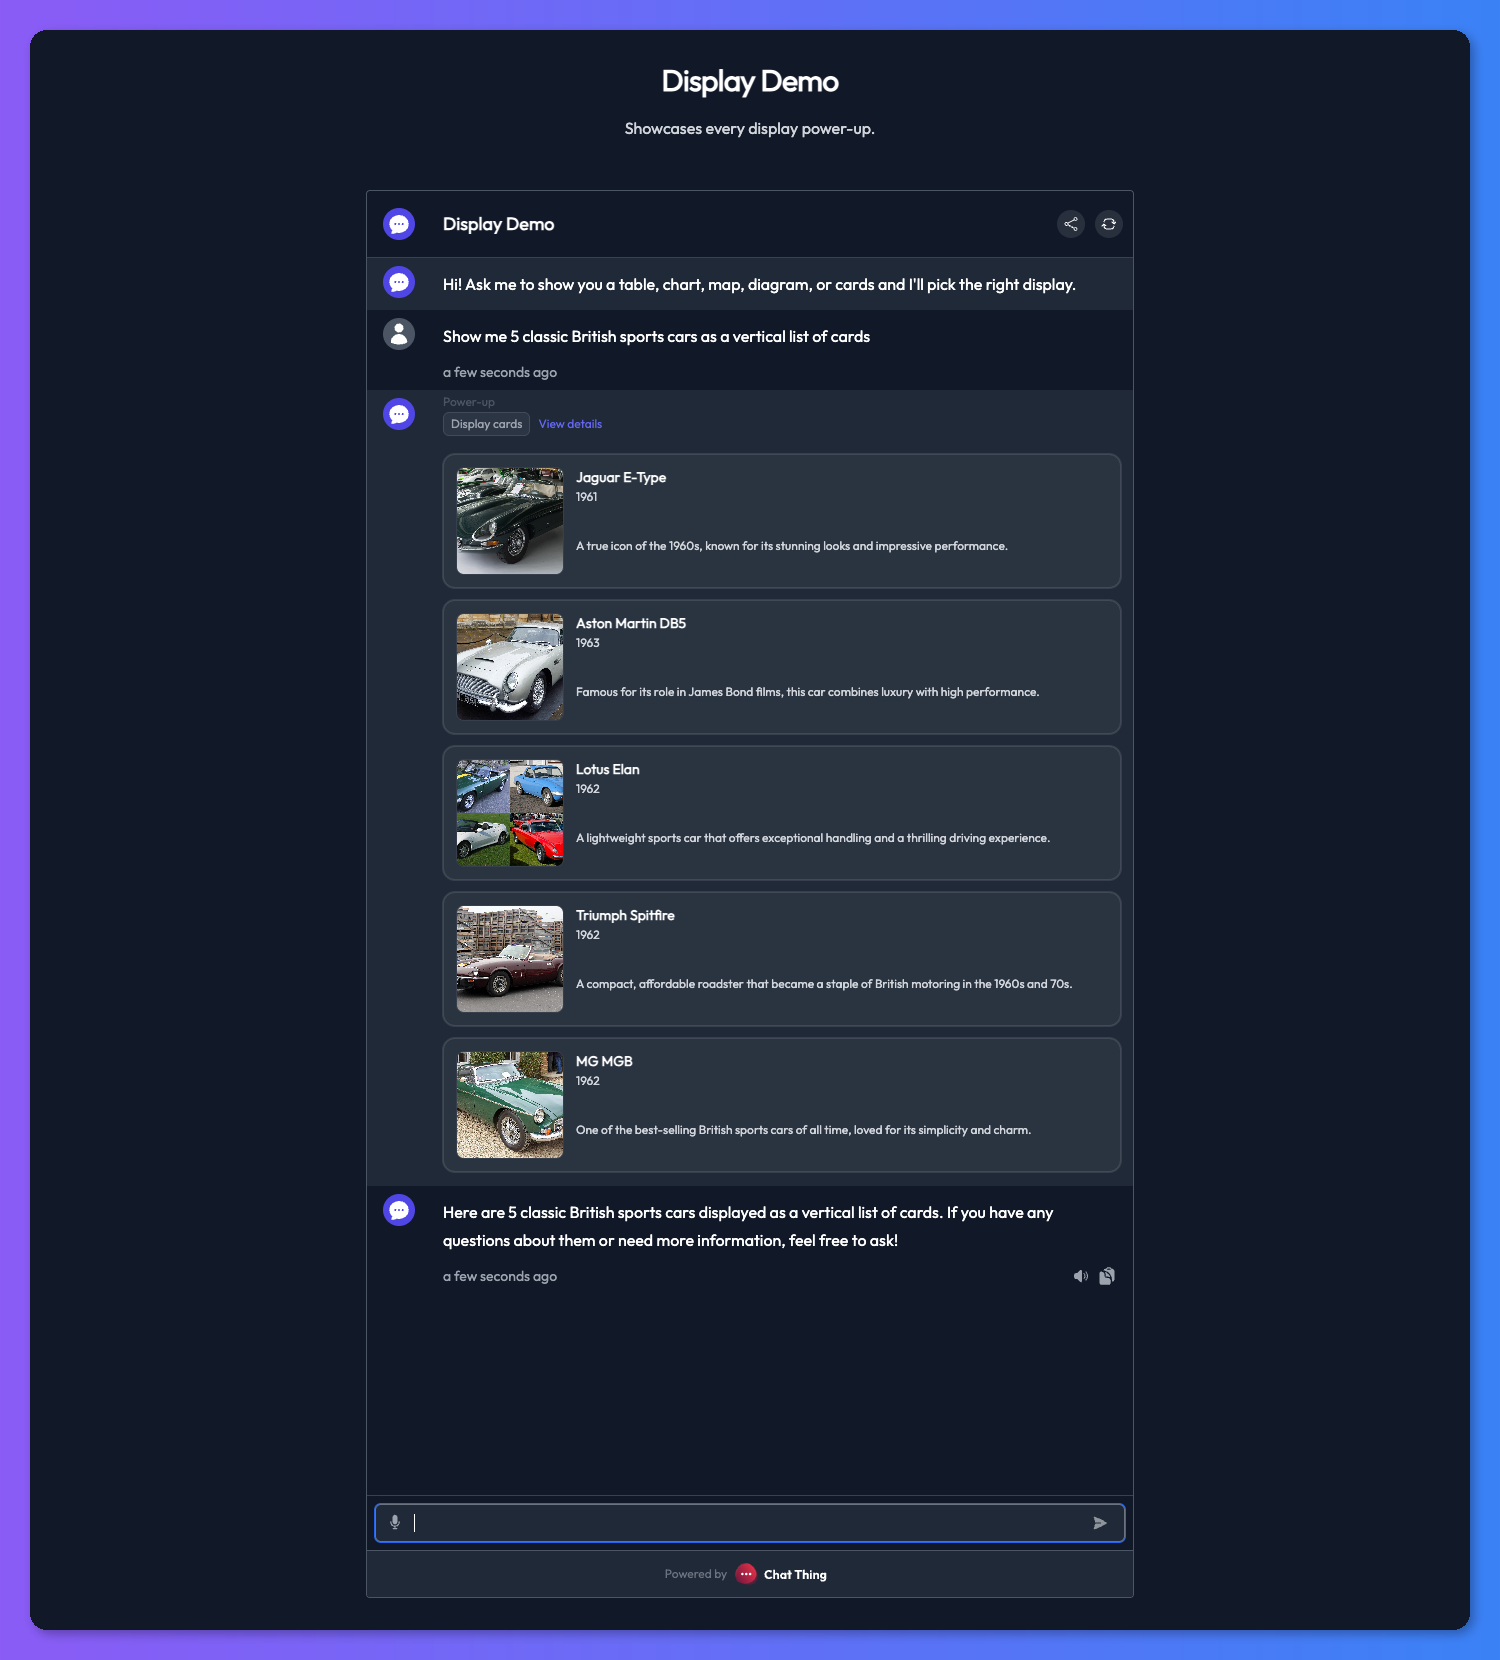
| Display cards | Products, listings, team members, search results: anything people browse. | None. The bot chooses a horizontal carousel or a vertical list each time. |
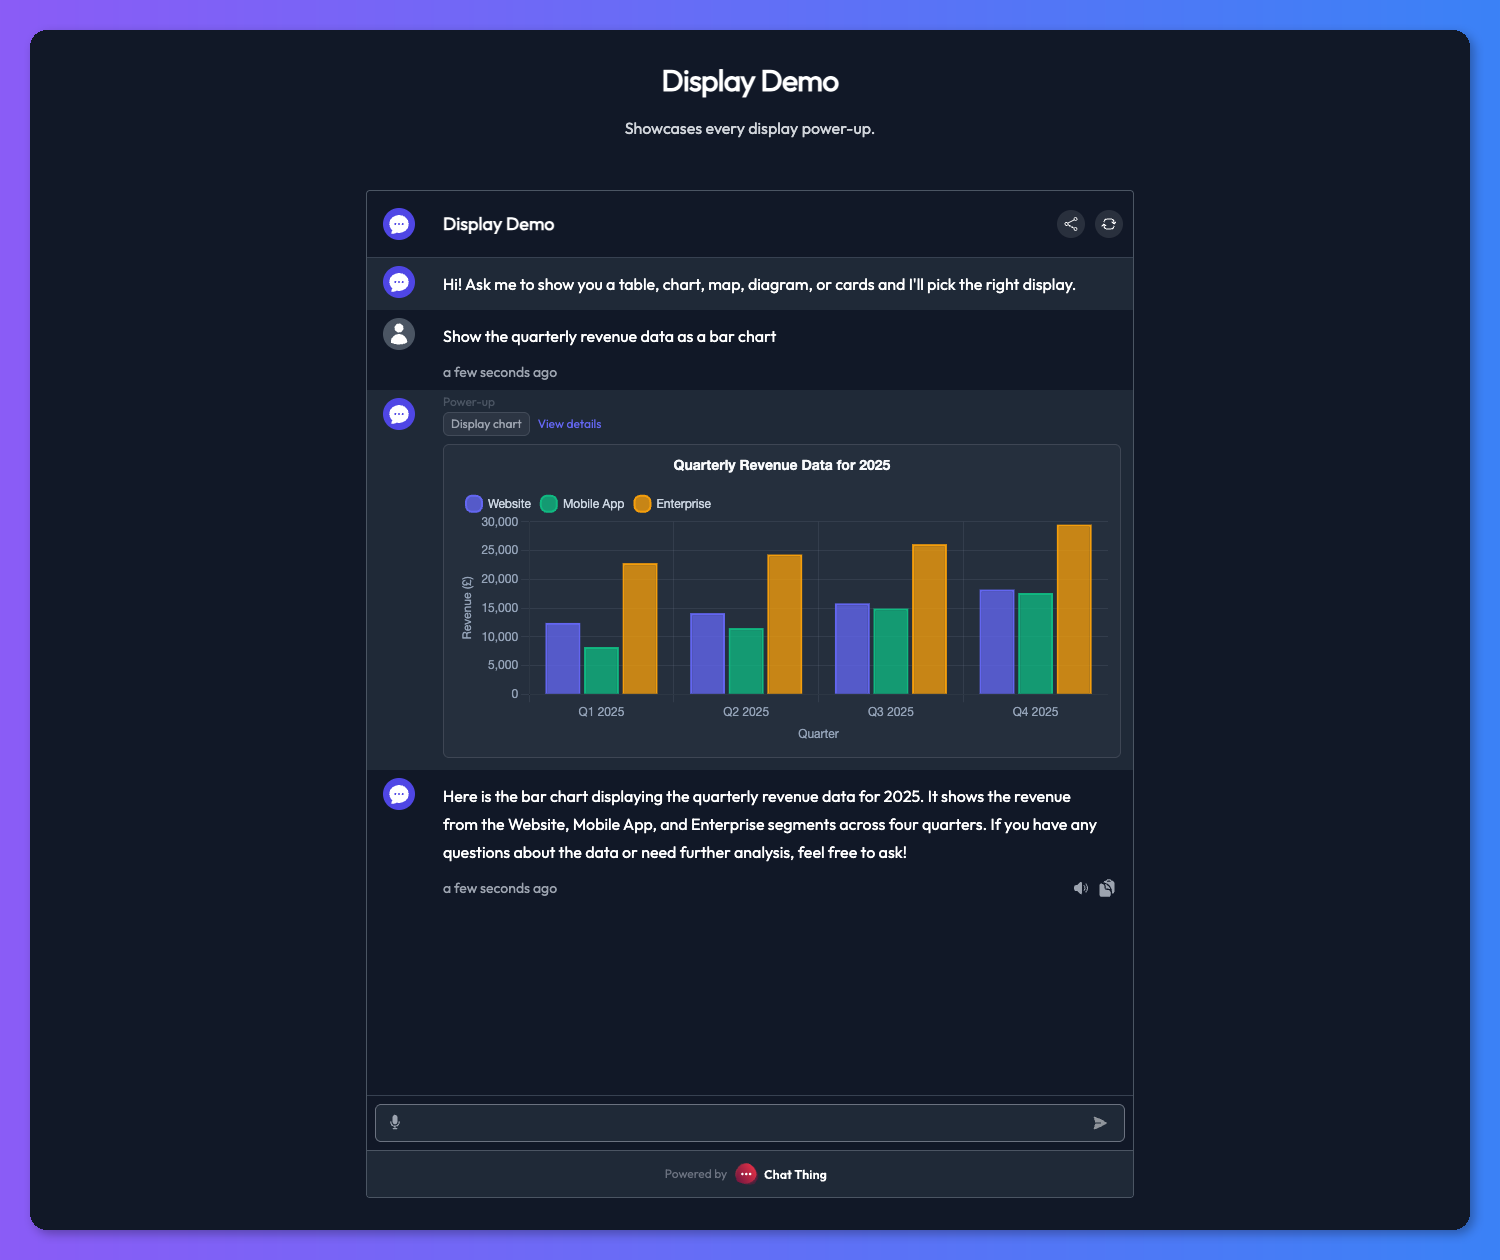
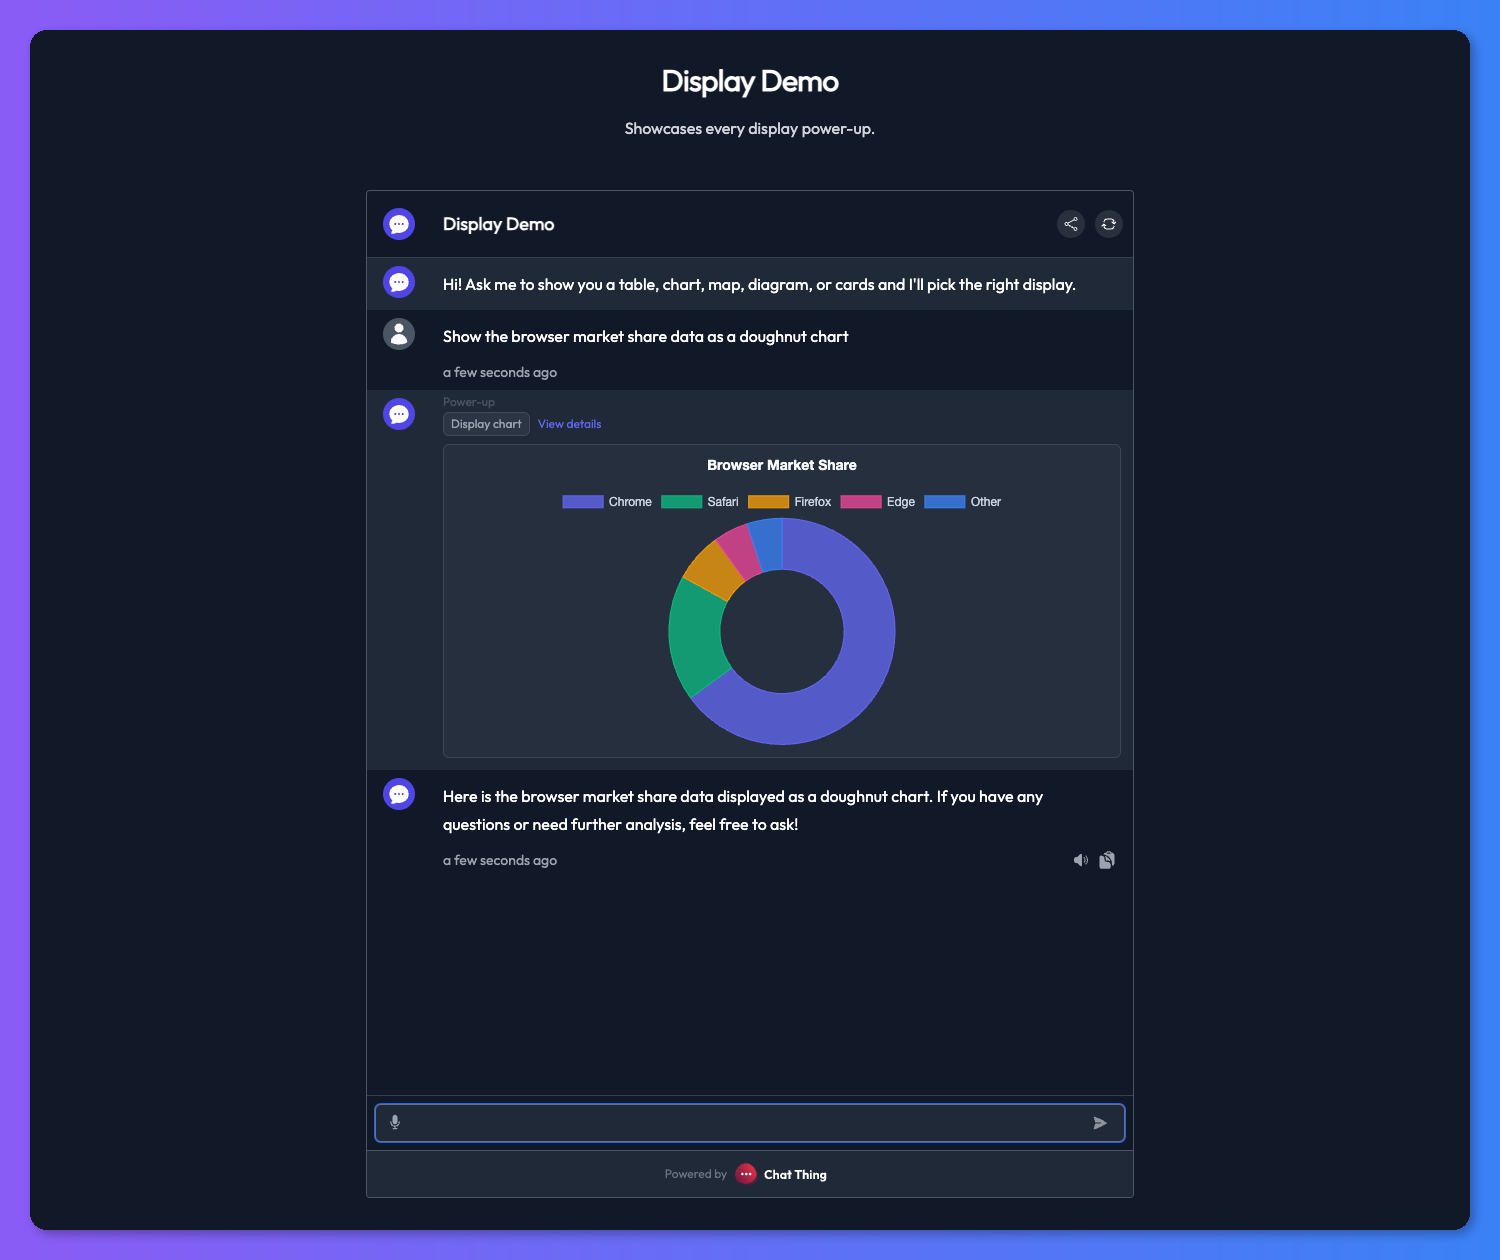
| Display chart | Numbers across categories or time. | Chart type: the default type (Bar, Line, Pie or Doughnut). The bot can use a different type when it suits the data better. |
| Display table | Comparing several fields across several items. | None. |
| Display map | Locations, routes and areas, like store finders or delivery zones. | Map style: Auto follows the chat's light or dark theme. Light and Dark force a style. |
| Display Mermaid | Processes, flowcharts, sequences and relationships. | None. |
Where displays appear
Displays appear in the website widget, when you test your bot in the dashboard, and in API responses. On Slack, WhatsApp, Telegram, email and other channels that can't show them, display power-ups aren't offered to the bot, so it replies in text instead.
Steps
- Open your bot, go to the Power-ups tab and click New power-up.
- Choose a display power-up, for example Display cards, and click Create power-up.
- Edit the Description to say when the bot should use it. This is the most important setting. For example: "Use this to show products whenever the user is browsing or comparing items."
- For Display chart and Display map, choose the default Chart type or Map style.
- Click Save.
- Repeat for any other display types you want.
What each display shows
Cards
Each card has a title and a short description, and optionally a subtitle (such as a price or status), an image (a direct image URL) and a url that opens when the card is clicked. The bot only adds the optional fields when it has real values.
Cards appear either as a horizontal, swipeable carousel (good for skimming several items) or as a vertical list (better when each card has more to read).
Charts
A chart has category or time labels and one or more datasets, each with a name and a list of numbers. It can also have a title and axis labels. Use bar charts to compare categories, line charts for trends over time, and pie or doughnut charts for parts of a whole with only a few slices.
Tables
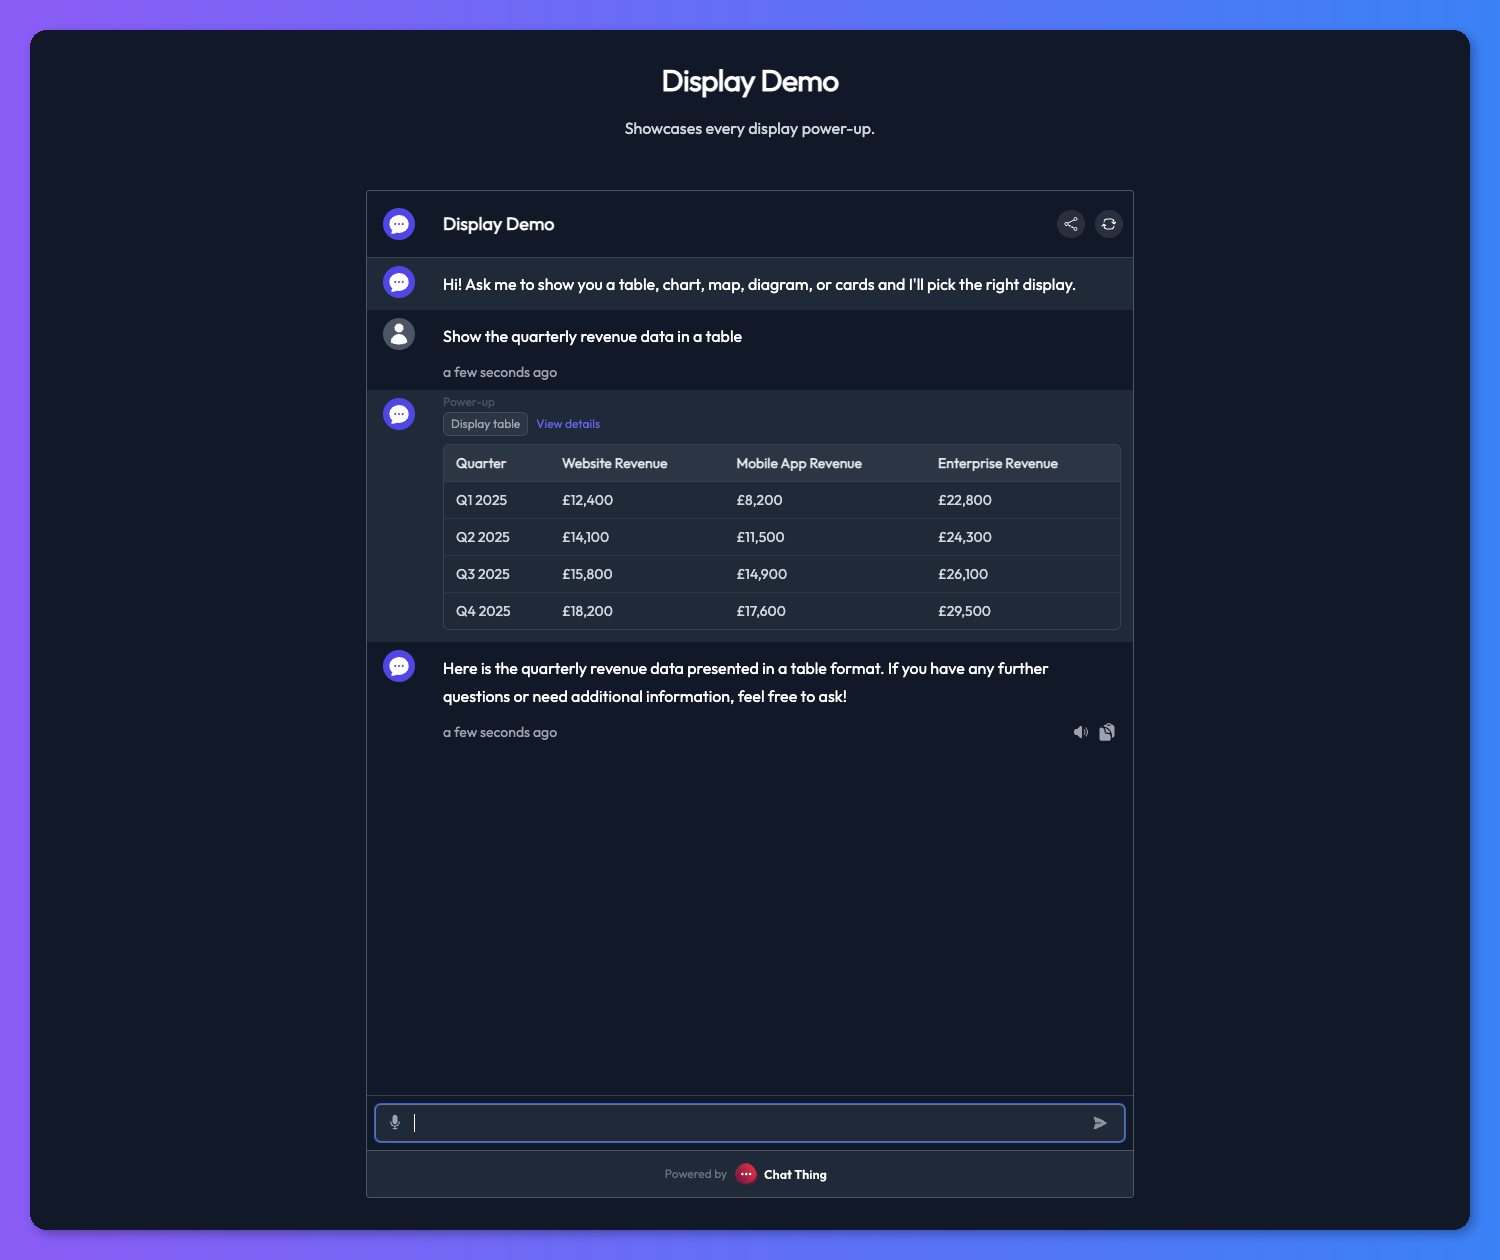
A table has columns, each with a label and a type, and rows of cells. Column types are text, image (shows a thumbnail from a URL) and link (shows a clickable link).
Maps
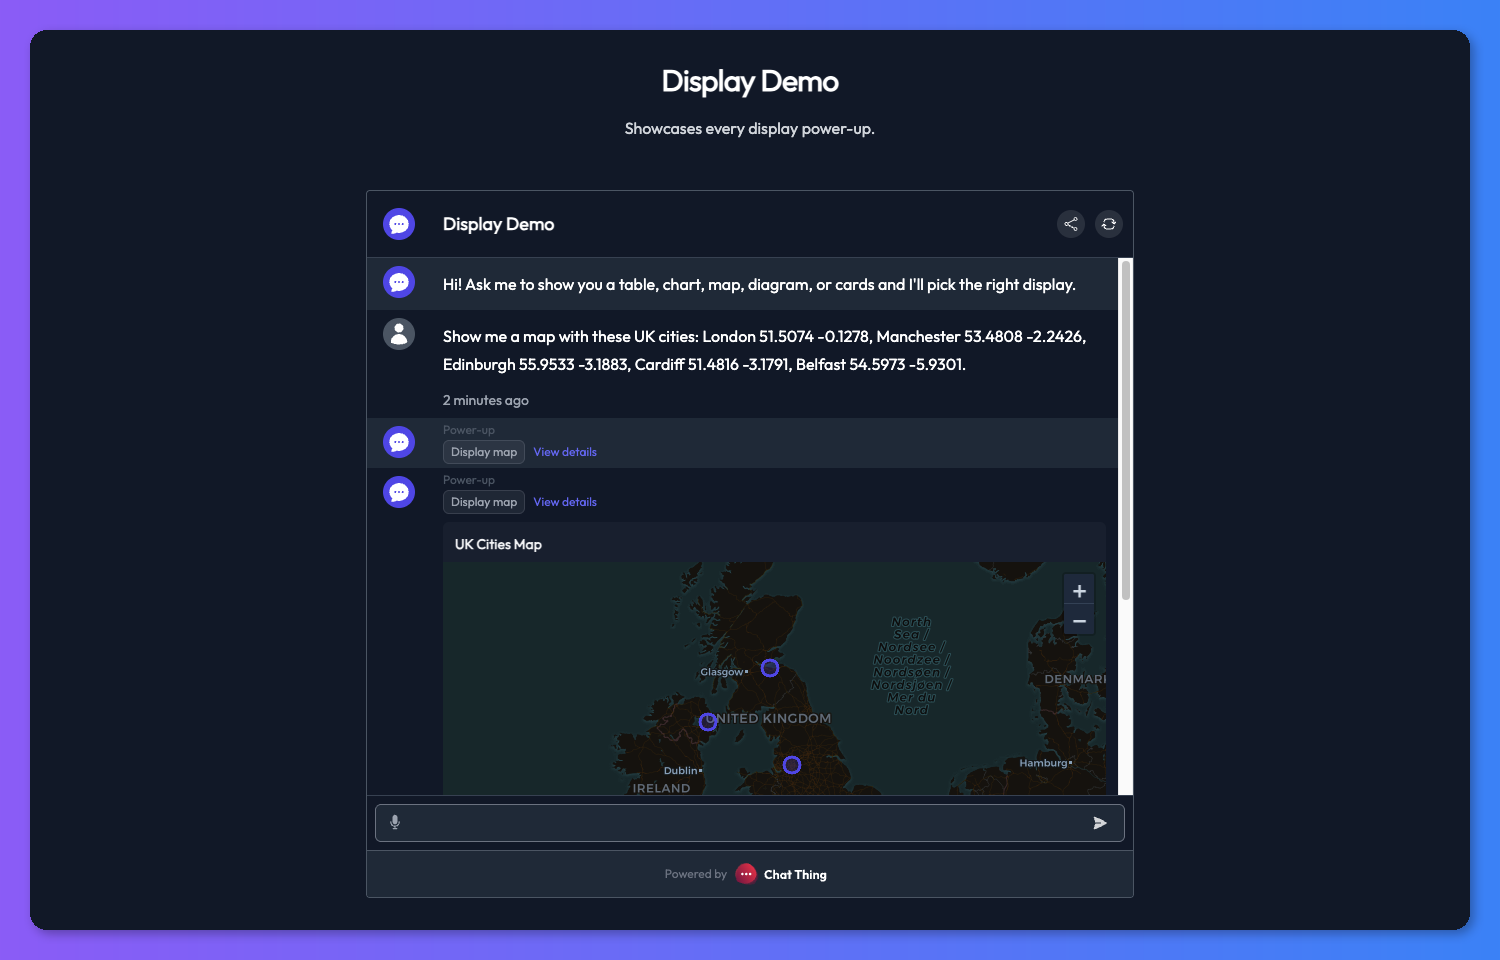
A map shows points (single locations), lines (routes) and polygons (areas). Each one can have a title, subtitle, description, image and link, which appear when someone selects it on the map. The bot needs coordinates to place things, so maps work best when your data includes them.
Mermaid diagrams
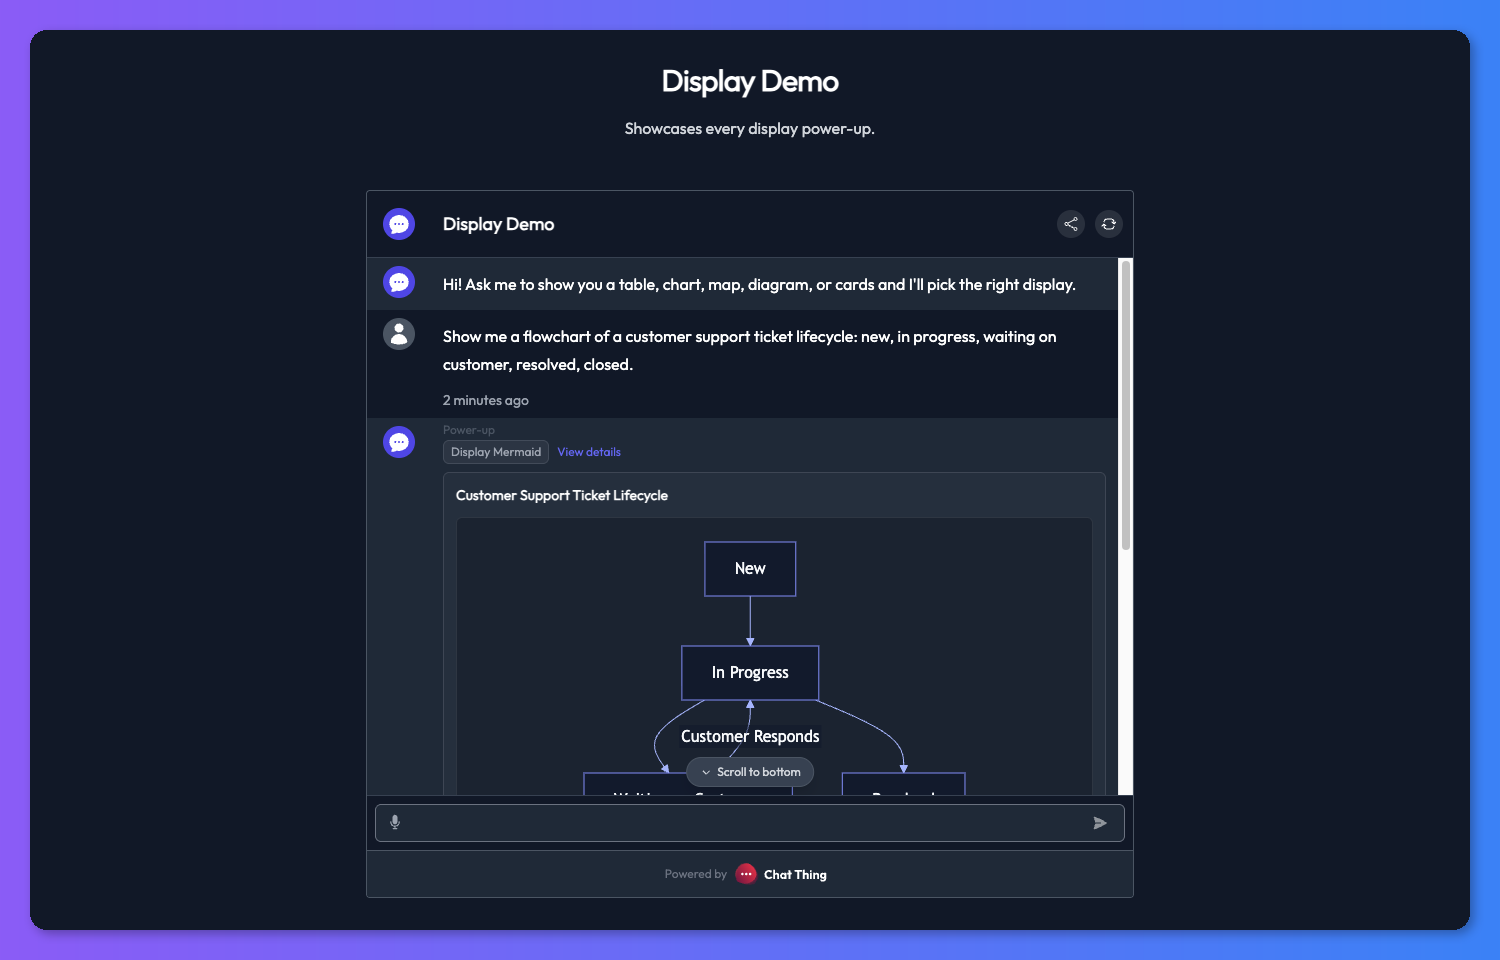
The bot writes Mermaid syntax, such as a flowchart, sequence diagram, entity-relationship diagram, Gantt chart or state diagram, and the chat draws it. You can steer the diagram type in the Description or your bot's prompt.
Tips
- Give the bot real content to show. Displays work best with a data source or power-up that provides concrete items (products, listings, figures), so the bot doesn't have to invent them.
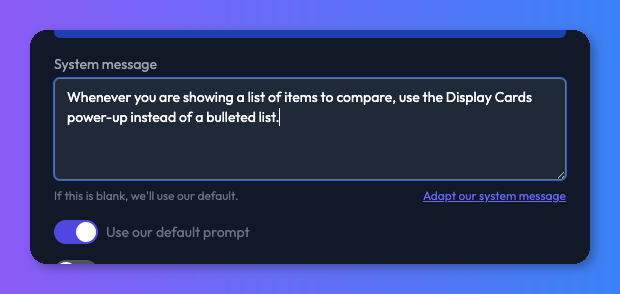
- Steer from the prompt. A line in your bot's prompt such as "When showing several items to compare, use the display power-ups instead of a bulleted list" is often enough to change the bot's default behaviour.
- Keep displays short. Short titles and descriptions read better in a chat window, especially on mobile. If the bot writes long card descriptions, say so in the Description.
- The bot knows what it showed. After a display appears, the bot won't normally repeat the same items in its text reply. Visitors can still ask it to compare, filter or explain what's on screen.
Check it works
- In the dashboard, chat with your bot and ask for something that should use the display, for example "Show me three of your products".
- Check that the display appears below the power-up label.
Troubleshooting
The bot replies in text instead of using a display
Make the power-up's Description clearer about when to use it, or add a rule to your bot's prompt. If you're testing in Slack, WhatsApp or another channel that can't show displays, text is expected.
The bot repeats information already shown in the display
- Add a rule to your bot's prompt, for example: "Don't repeat items you've already shown as cards, charts or other displays."
- Try a more capable model. Less capable models are more likely to repeat themselves.
Related
- Show a power-up's results visually
Turn on a display mode so a power-up's results, such as an API response or search results, appear as cards, a chart, a table, a map or a diagram.
- How power-ups work
What power-ups are, how to add, edit, turn off and delete them, how your bot decides to use one, and what visitors see in the chat.
Last updated