Show a power-up's results visually
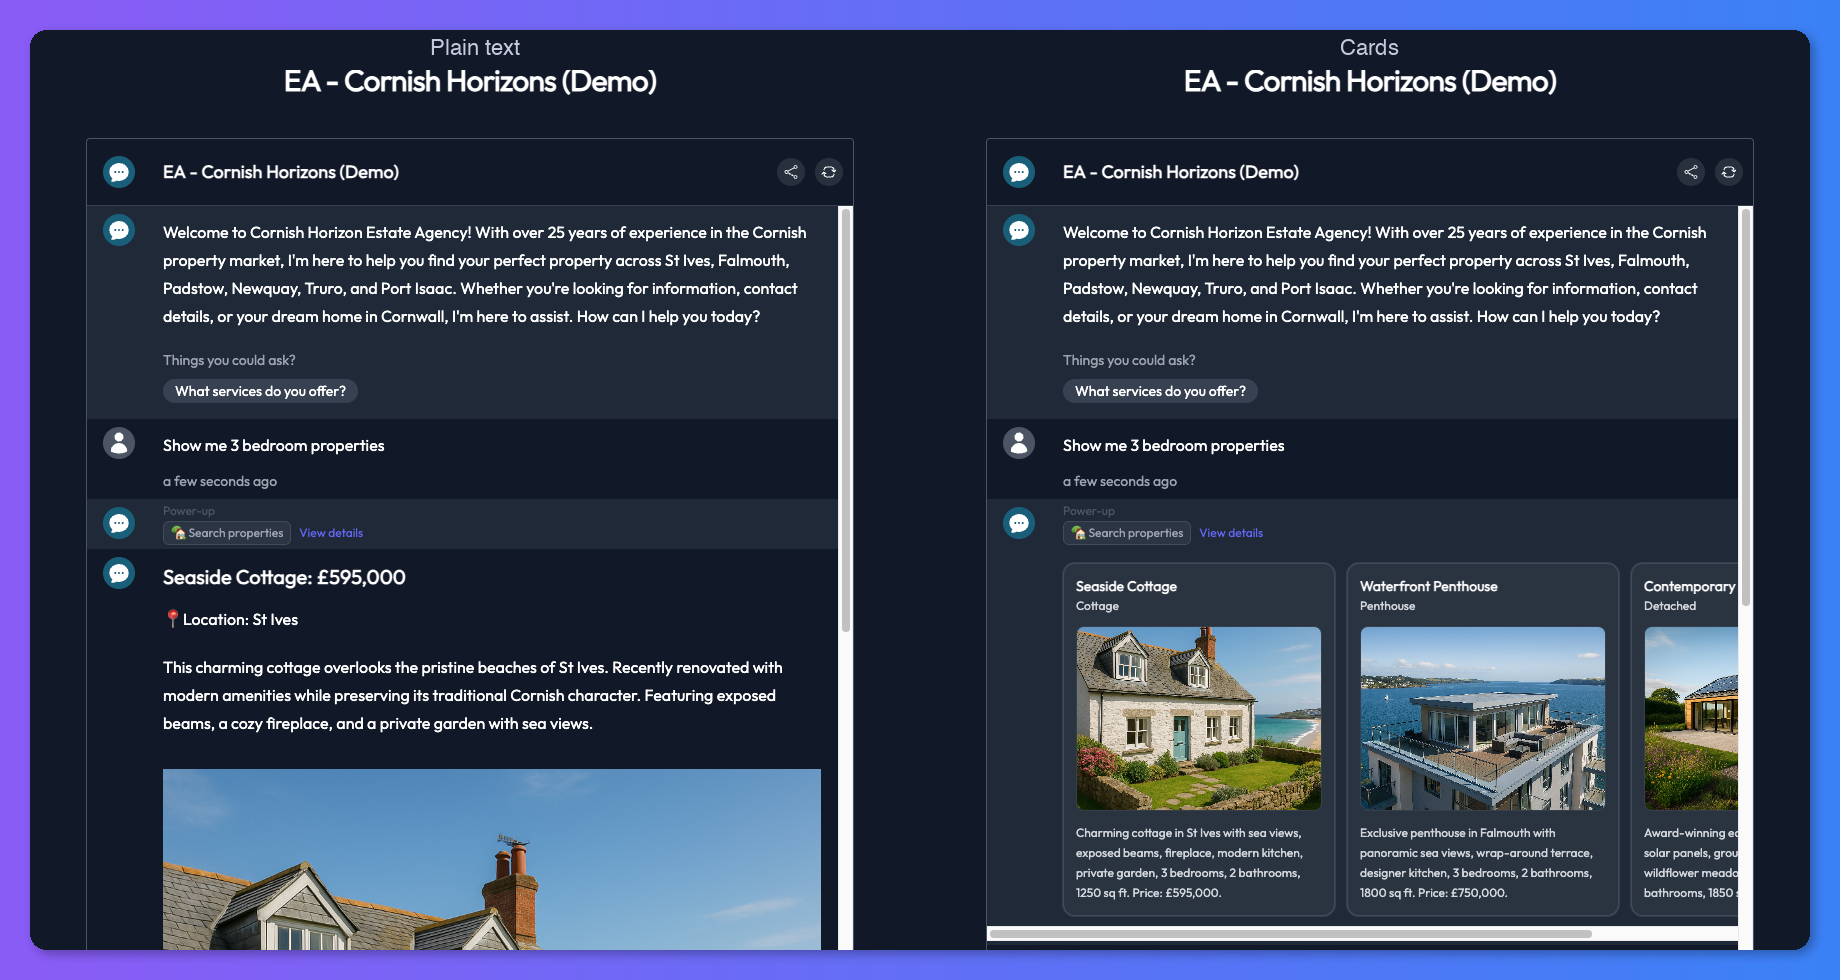
Turn on a Display mode for a power-up so that every time it runs, its result is shown as cards, a chart, a table, a map or a Mermaid diagram rather than being described in text.
Who can do this: team owners and admins.
For example, an API request power-up that searches your product catalogue can show each result as a card with a photo, price and link.
How it works
After the power-up runs, Chat Thing gives its raw result and your Display transform prompt to an AI model, which converts the result into the display. The bot also gets the result as text, so it can still talk about it. If the conversion fails, or the chat can't show displays, the visitor gets a normal text reply.
This is different from display power-ups, which the bot chooses to use for any content. A display mode belongs to one power-up and applies to all of its results.
Which power-ups support display modes
The Display mode section appears at the bottom of the settings page for:
- API request (Call your API)
- Browse web page (Browse a web page)
- Google Search (Search Google)
- Query a Notion Database, Search for Notion Page and Search for Notion Database (Notion)
If a power-up's settings page has no Display mode section, its results are always text.
Steps
- Open the power-up's settings page: on the Power-ups tab, open the menu on its card and click Settings.
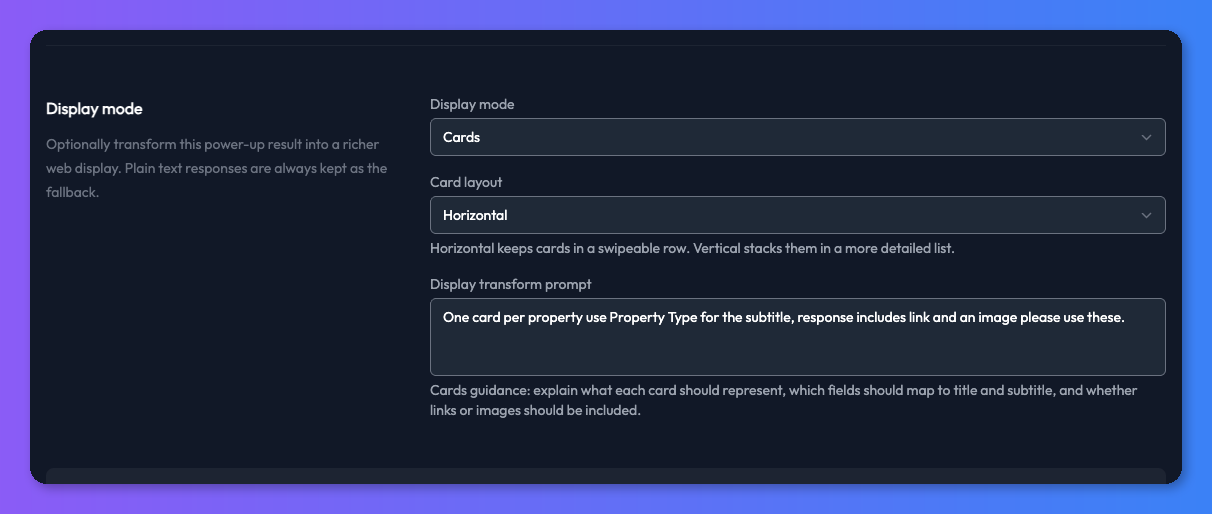
- Scroll to Display mode and choose a mode from the Display mode list: Cards, Chart, Table, Map or Mermaid. Off turns it off.
- Set any extra option for that mode (see below).
- Write a Display transform prompt that explains how to map the result onto the display (see below).
- Click Save.
Choose a mode
Pick the mode that matches the shape of the data. Displays describes what each one shows.
| Mode | Use it when the result is… | Extra option |
|---|---|---|
| Cards | A list of items to browse, like products or search results. | Card layout: Horizontal (a swipeable row) or Vertical (a detailed stacked list). |
| Chart | Numbers across categories or time. | Chart type: Bar, Line, Pie or Doughnut. |
| Table | Several fields to compare side by side. | None. The prompt decides the columns. |
| Map | Places with coordinates. | Map style: Auto, Light or Dark. |
| Mermaid | Steps, a process or relationships. | None. The prompt decides the diagram. |
The option you set always applies. For example, with Chart type set to Line, every result from that power-up is drawn as a line chart.

Write the display transform prompt
The Display transform prompt is the most important setting. Describe the display you want, not what the power-up does. Say what each item represents and which fields go where. Each mode shows an example as a placeholder.
- Cards: "One card per product. Use the product name as the title and the price as the subtitle, keep descriptions under two sentences, and use the product image URL as the image."
- Chart: "Plot month on the x-axis and revenue on the y-axis. Title the chart 'Monthly revenue'."
- Table: "One row per property, with columns for a photo (image), address, price and a link to the listing."
- Map: "Plot each store as a point using its latitude and longitude, with the store name as the title and opening hours as the description."
If the display is missing something you expected, sharpen this prompt first. It's almost always quicker than changing the power-up or the API behind it.
Display modes and the API response prompt
On the API request power-up, the Response prompt runs first and the display transform runs on its output. If your API returns a lot of data, use the response prompt to cut it down to the fields the display needs. This makes the display faster and more reliable.
Check it works
- In the dashboard, chat with your bot and ask something that triggers the power-up.
- Check that the display appears below the power-up label.
- If it doesn't look right, click the label, then View details on the call. The Power-up result shows the raw data the display was built from.
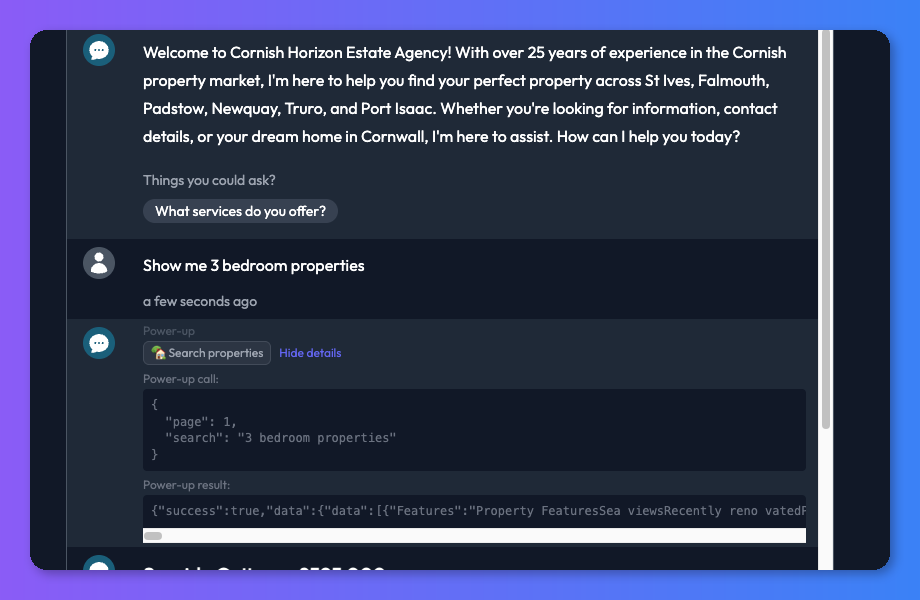
The power-up label above the details looks different in today's chat.
Troubleshooting
A field is missing from the display
Check View details to confirm the field is in the raw result. If it is, name it explicitly in the Display transform prompt, for example "use image_url as the card image". If it isn't, the power-up isn't returning it.
The display is broken, slow or doesn't appear
The result is probably too large to convert reliably. Return less data, for example by asking your API for fewer results or trimming it with the Response prompt. If the display still fails, the visitor gets a text reply.
Visitors on Slack or WhatsApp don't see the display
Displays only appear in the website widget, the dashboard and API responses. Other channels get the text reply.
The bot repeats what's already in the display
Related
- Show cards, charts, tables, maps and diagrams in chat
Add display power-ups so your bot can show results as cards, charts, tables, maps or Mermaid diagrams in the web chat, instead of plain text.
- Call your API from your bot
Let your bot call any HTTP API to look up or send data, such as order status, stock levels or new leads, using the API request power-up.
Last updated