

While we were testing the new Chat Thing analytics with a real estate customer, the dashboard flagged something nobody on the team had spotted. The same complaint kept coming up in conversation after conversation: for-sale signs were being left up on houses long after the houses had sold, and customers were quietly getting fed up about it.
The recommendation the dashboard wrote back was as plain as the problem. Take the signs down sooner.
That isn't the kind of insight you find by staring at a pie chart. It's what a member of staff might pick up if they read every single chat from the past week, and even then only if they were paying close attention.
Today we're shipping the new Analytics dashboard for Chat Thing. It does the reading for you, and it tells you what to do.
What's in it
Open the Overview tab on any agent, pick a month range, and you get five sections that answer the questions you opened the dashboard to ask.
Topic Analysis
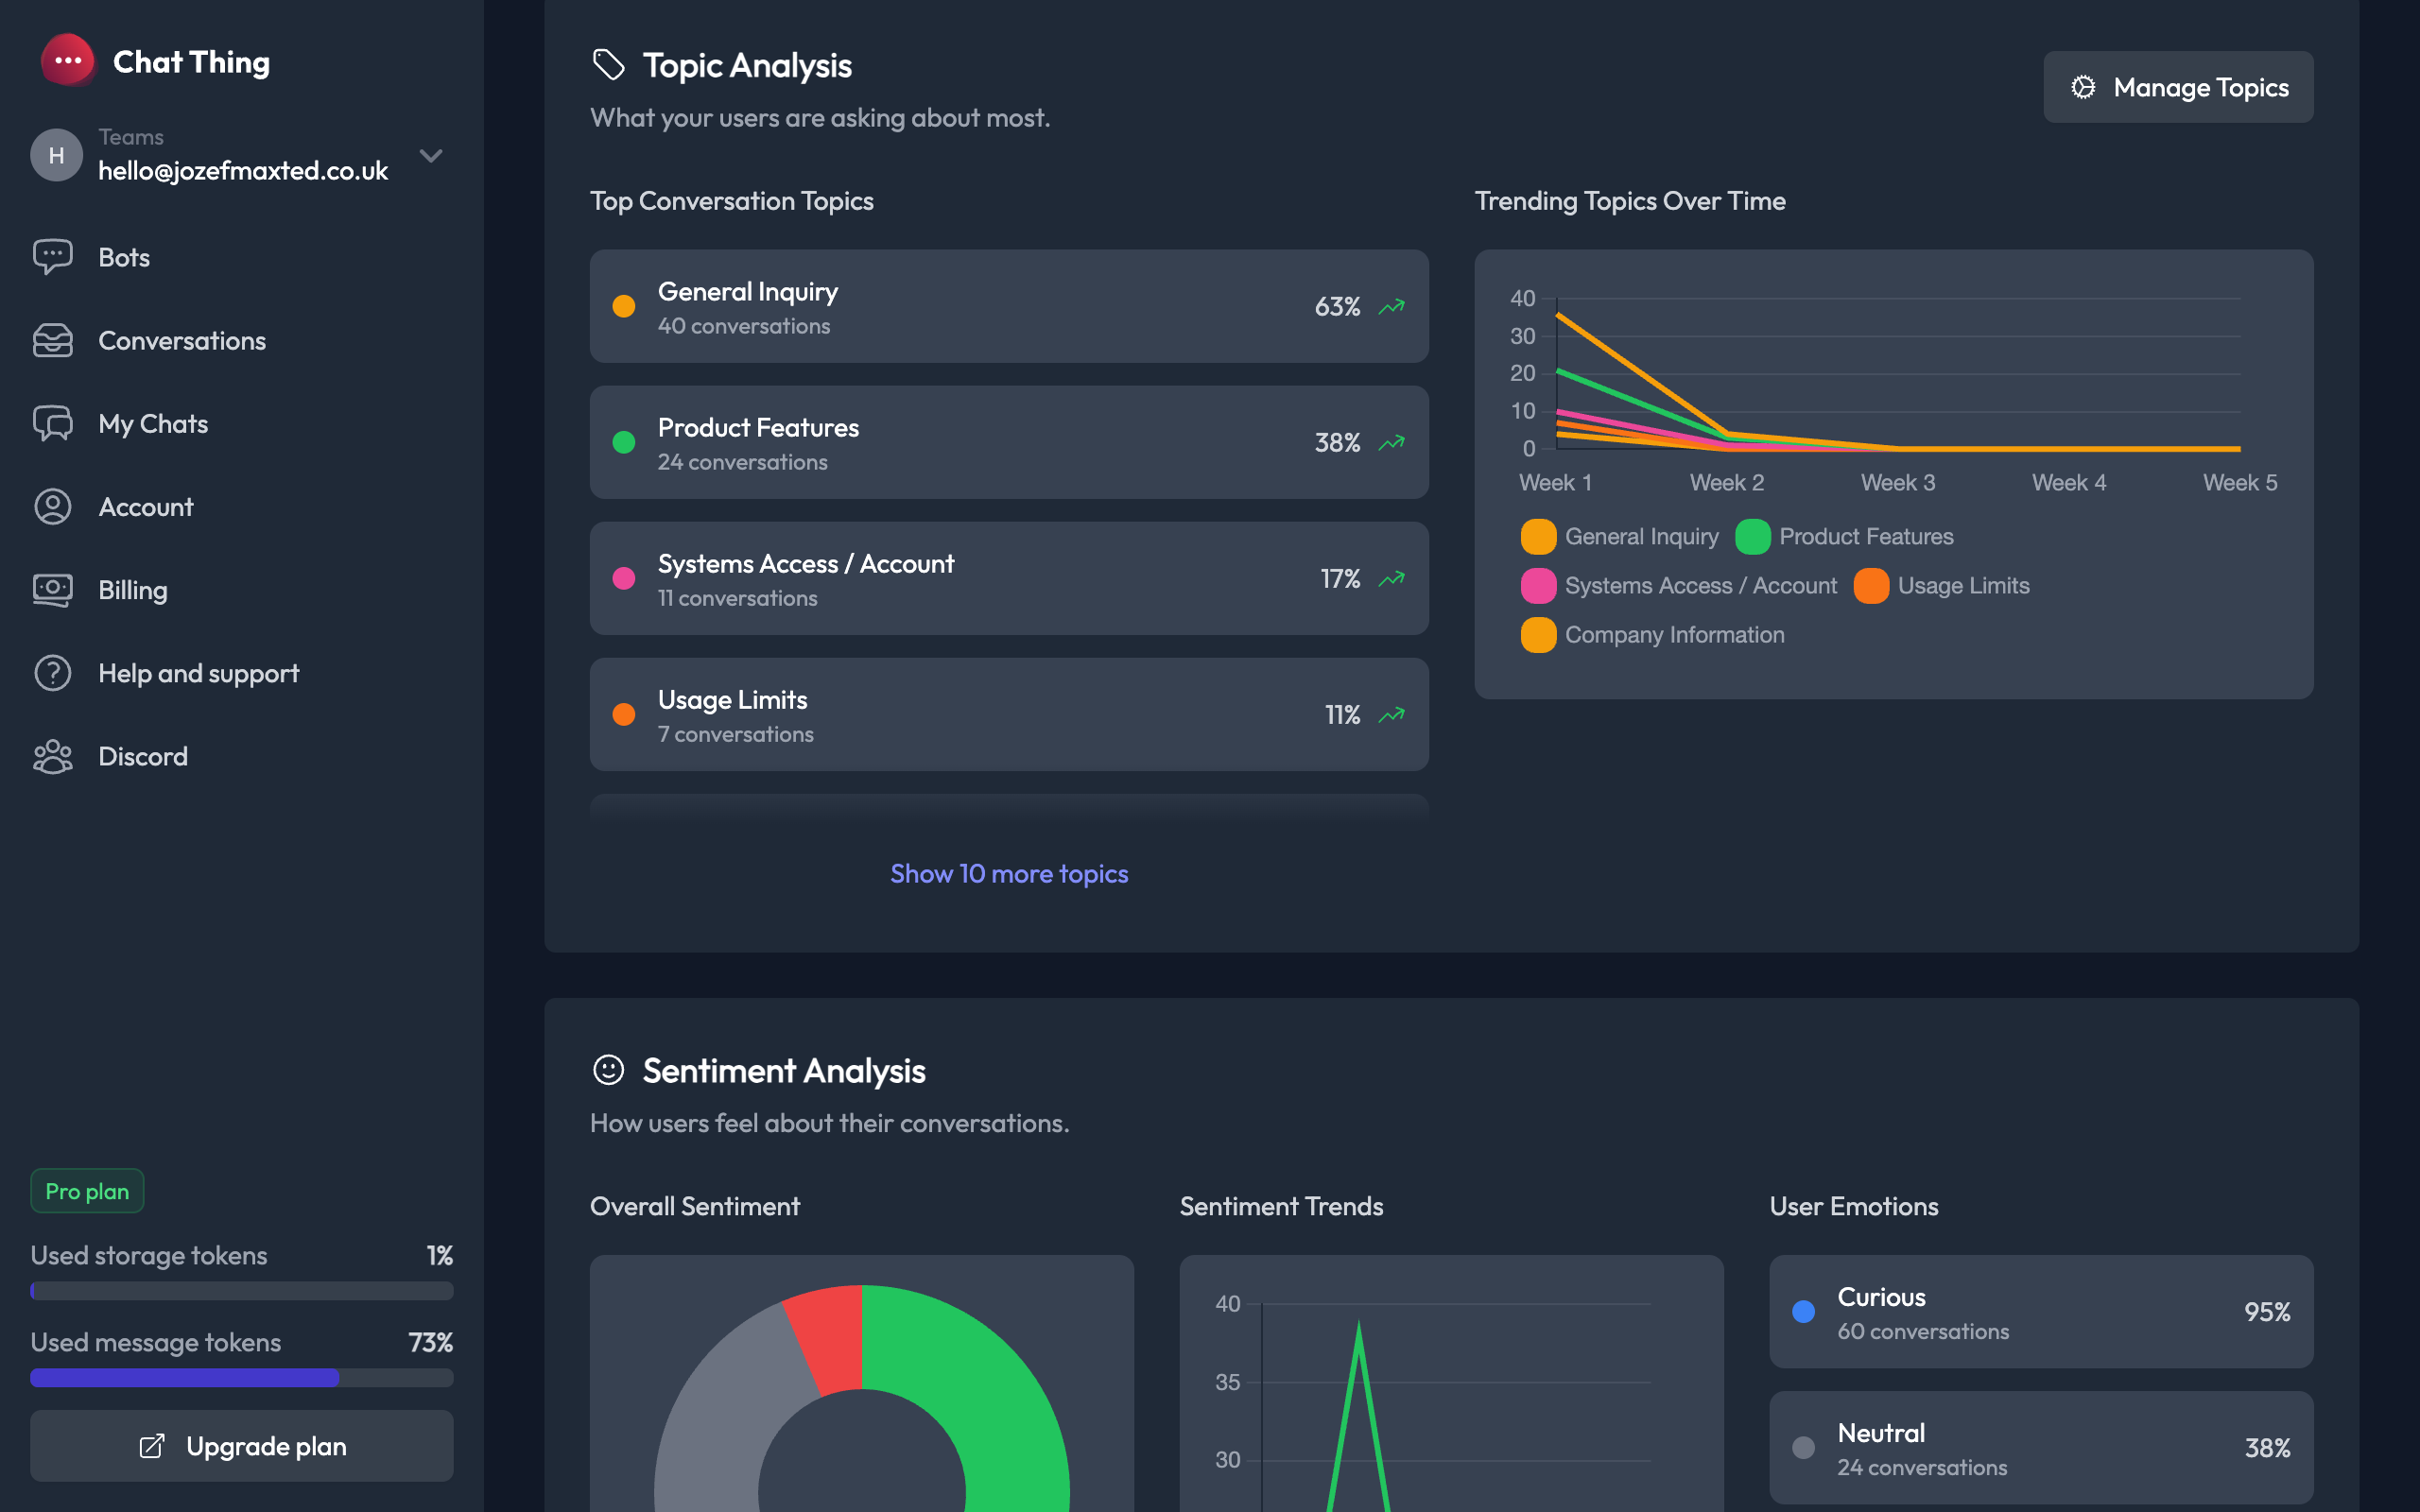
Every conversation grouped by what it was actually about. Not raw keywords, themes.
Top Conversation Topics gives you a ranked list with counts and percentages. Trending Topics Over Time is a weekly line chart that shows which subjects are climbing and which are falling.
You can manage up to ten custom topics per agent, rename them, colour-code them, or have Chat Thing generate them from your conversation data.
Sentiment Analysis
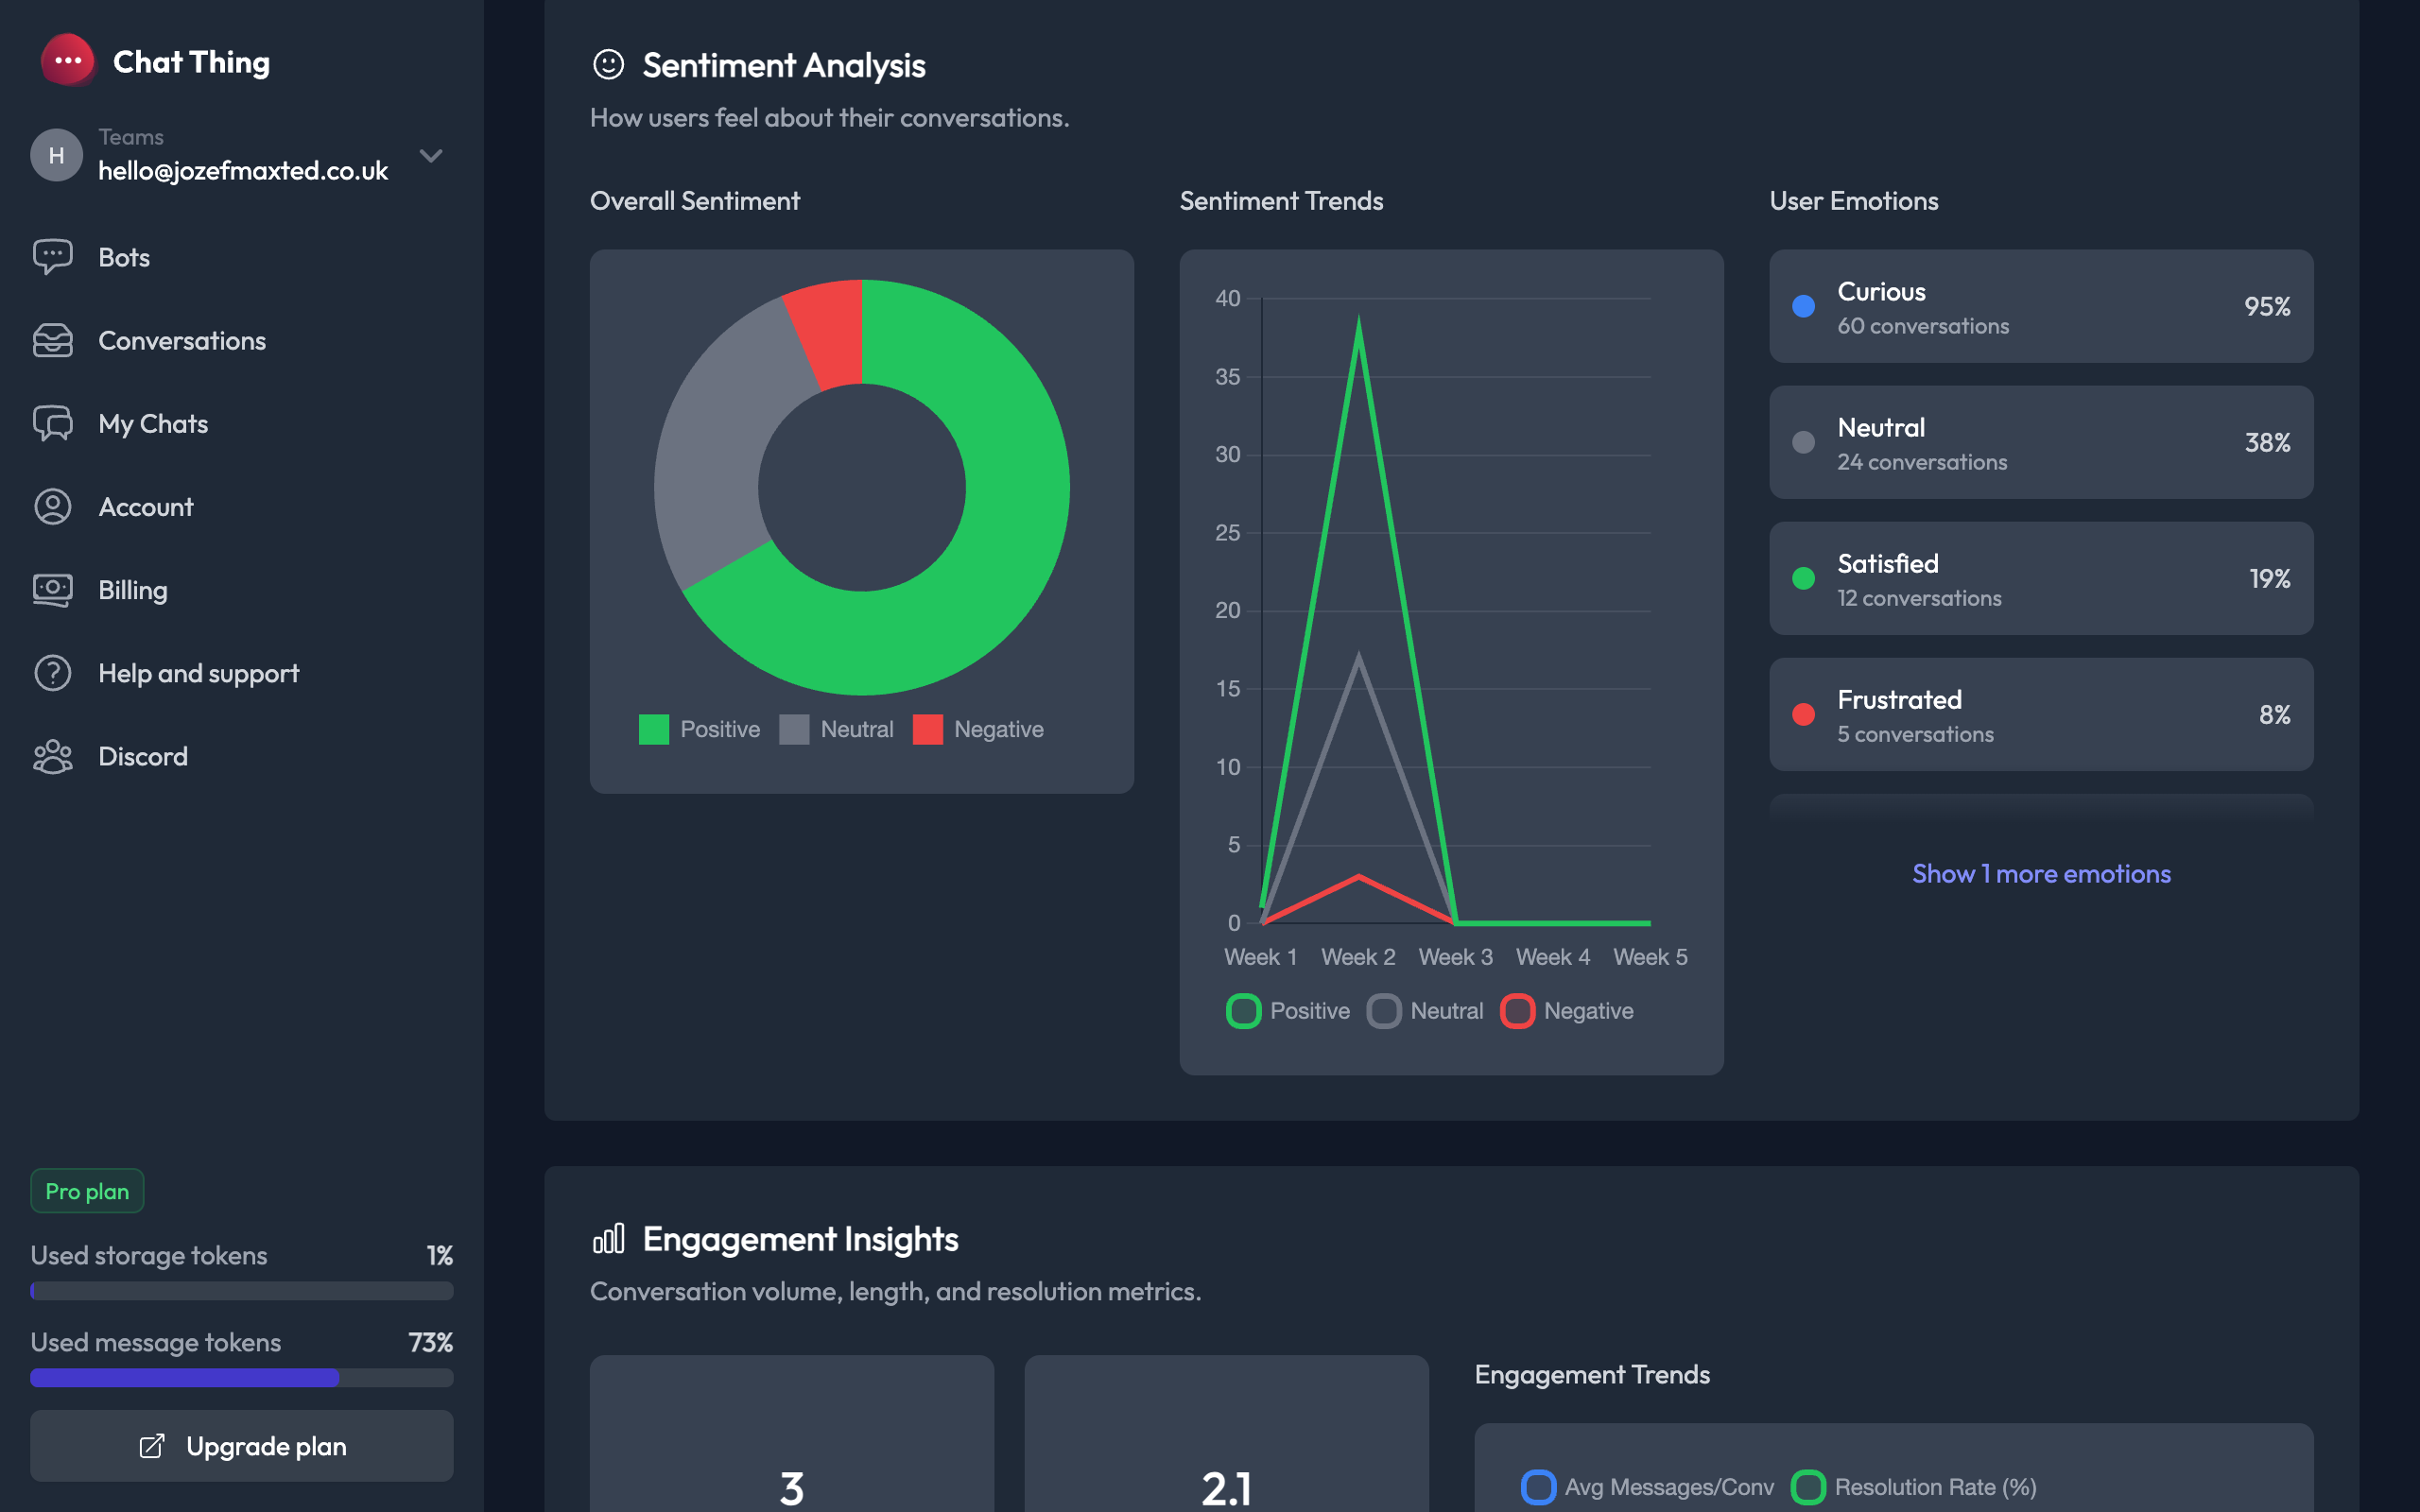
A donut chart breaks every conversation into Positive, Neutral, or Negative. A trend line shows whether your users are getting happier or more frustrated week by week.
Emotion detection goes one level deeper. How often users are Curious, Satisfied, Frustrated, Confused, and the rest, with percentages for each.
Engagement Insights
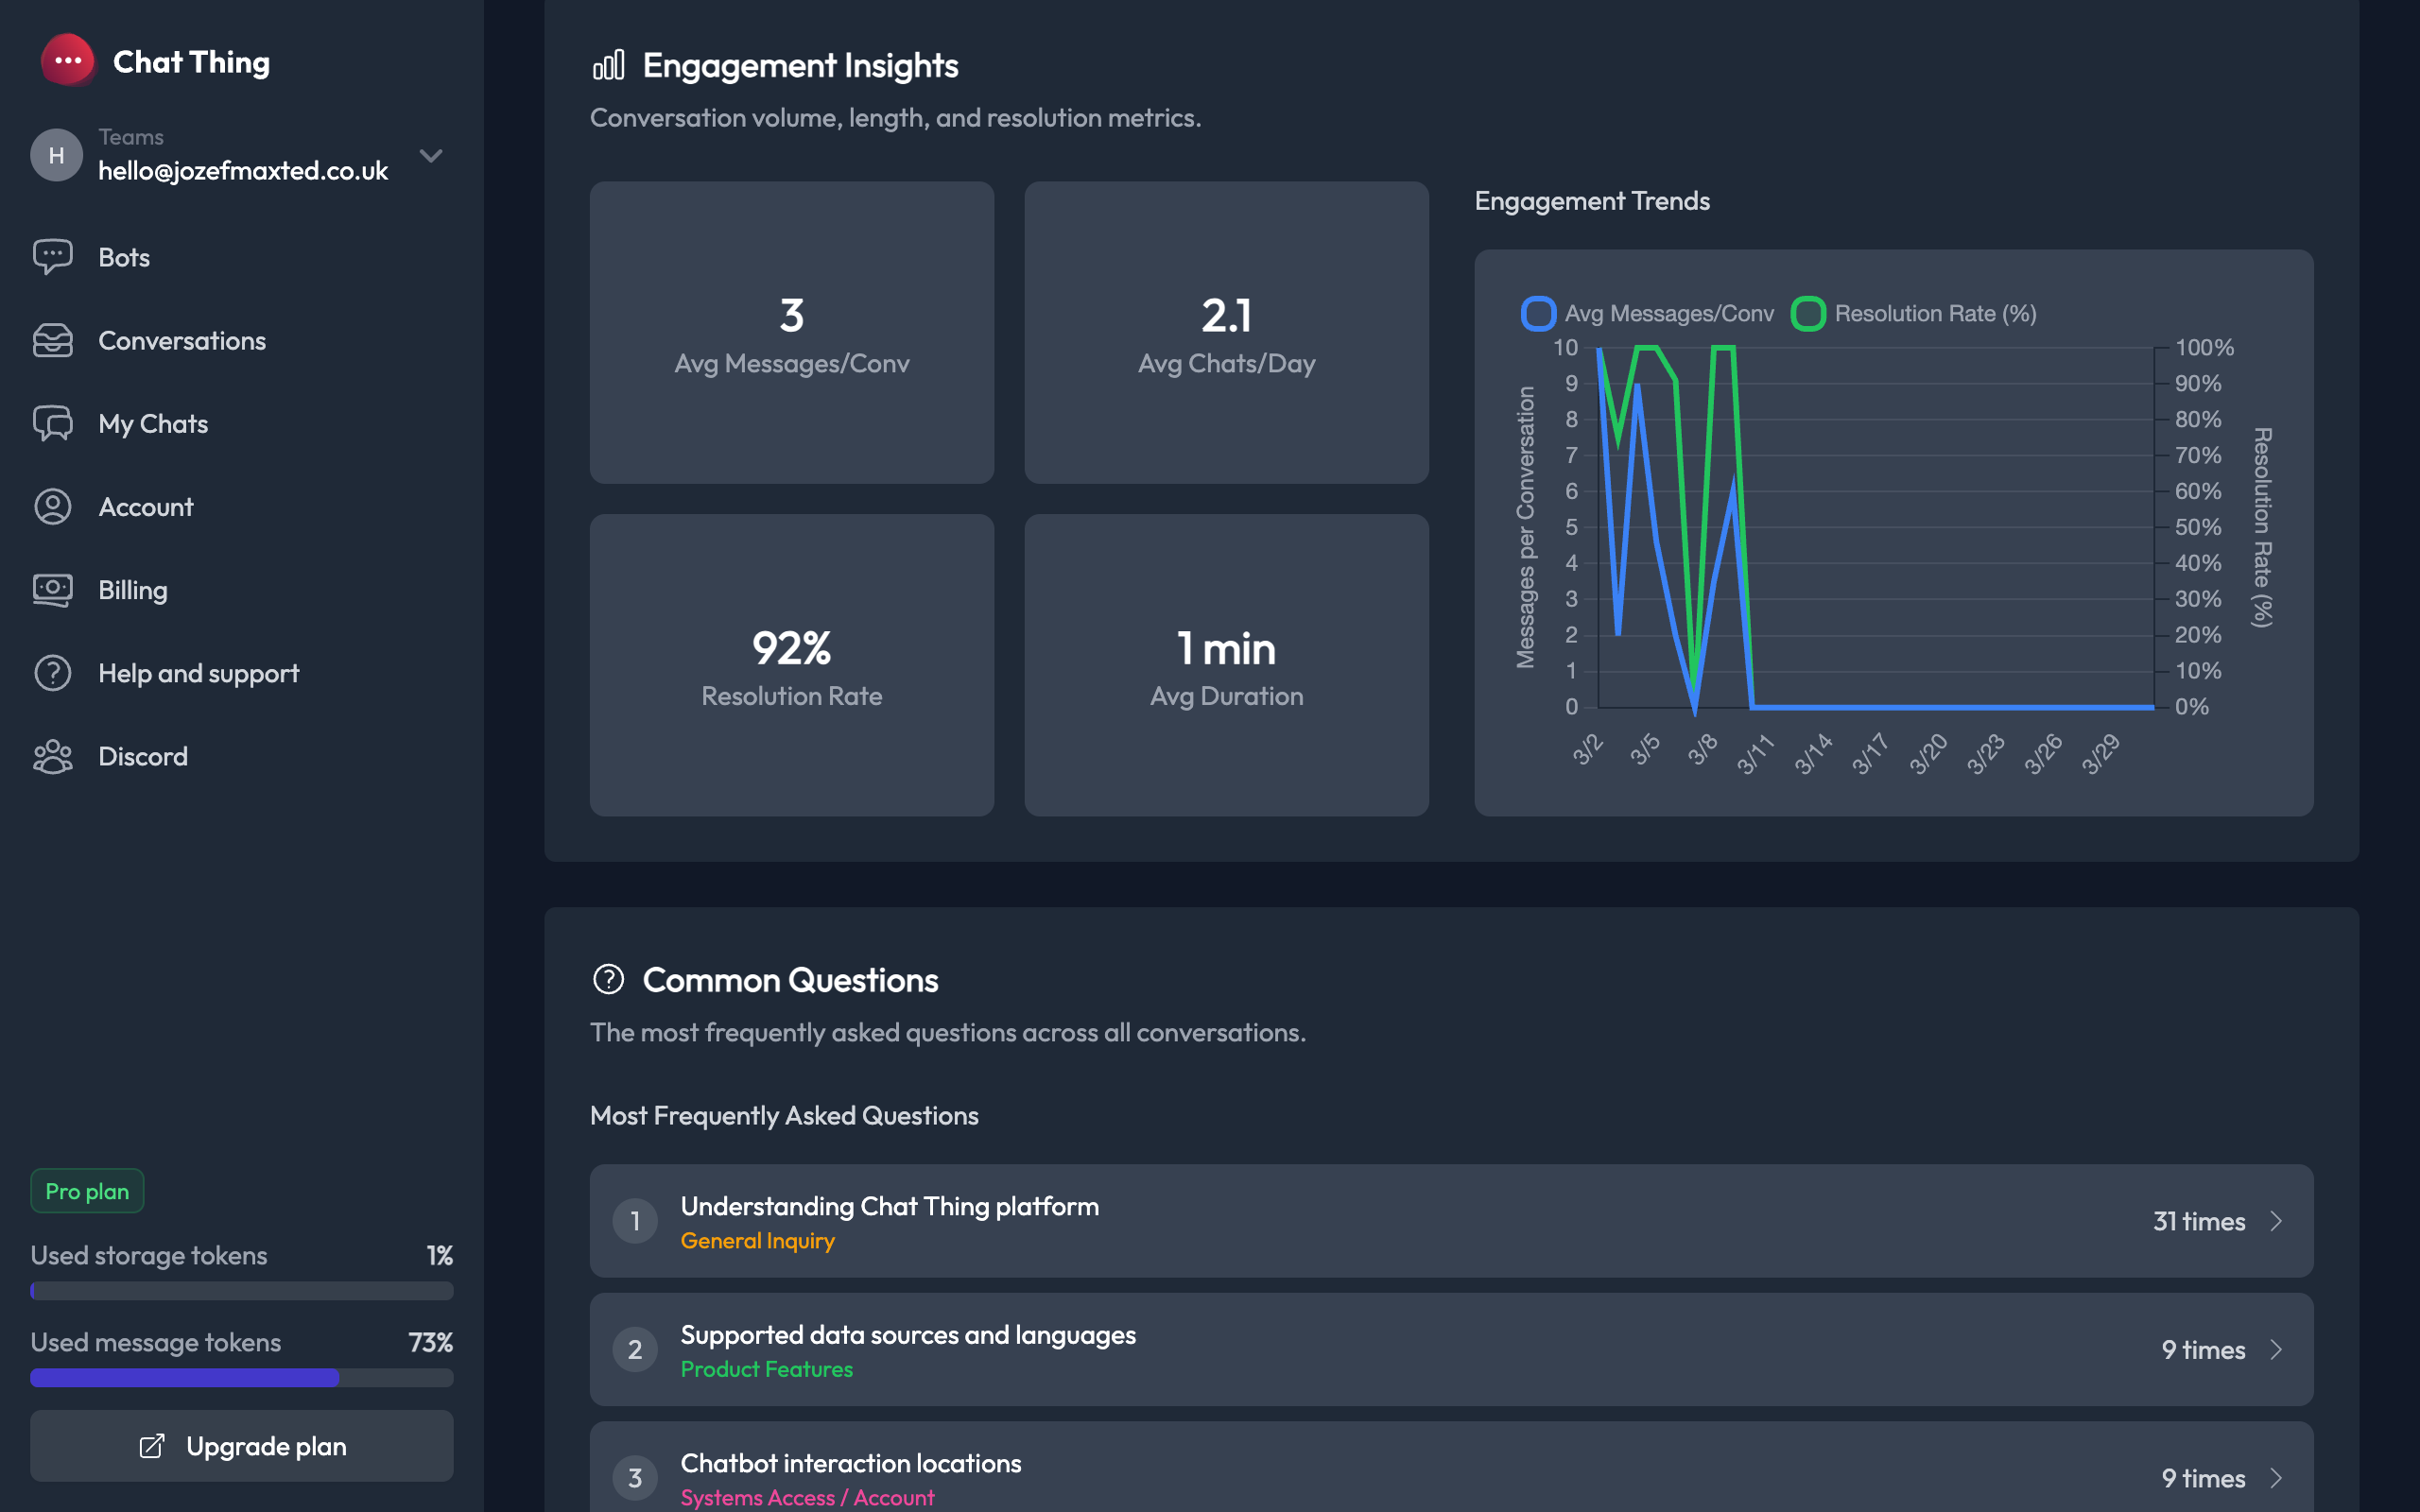
The conversation quality metrics most teams want, in one place.
Average messages per conversation. Average daily chat volume. Resolution rate. Average conversation duration. The trend chart plots messages-per-conversation against resolution rate, so you can tell whether longer chats are actually helping anyone.
Common Questions
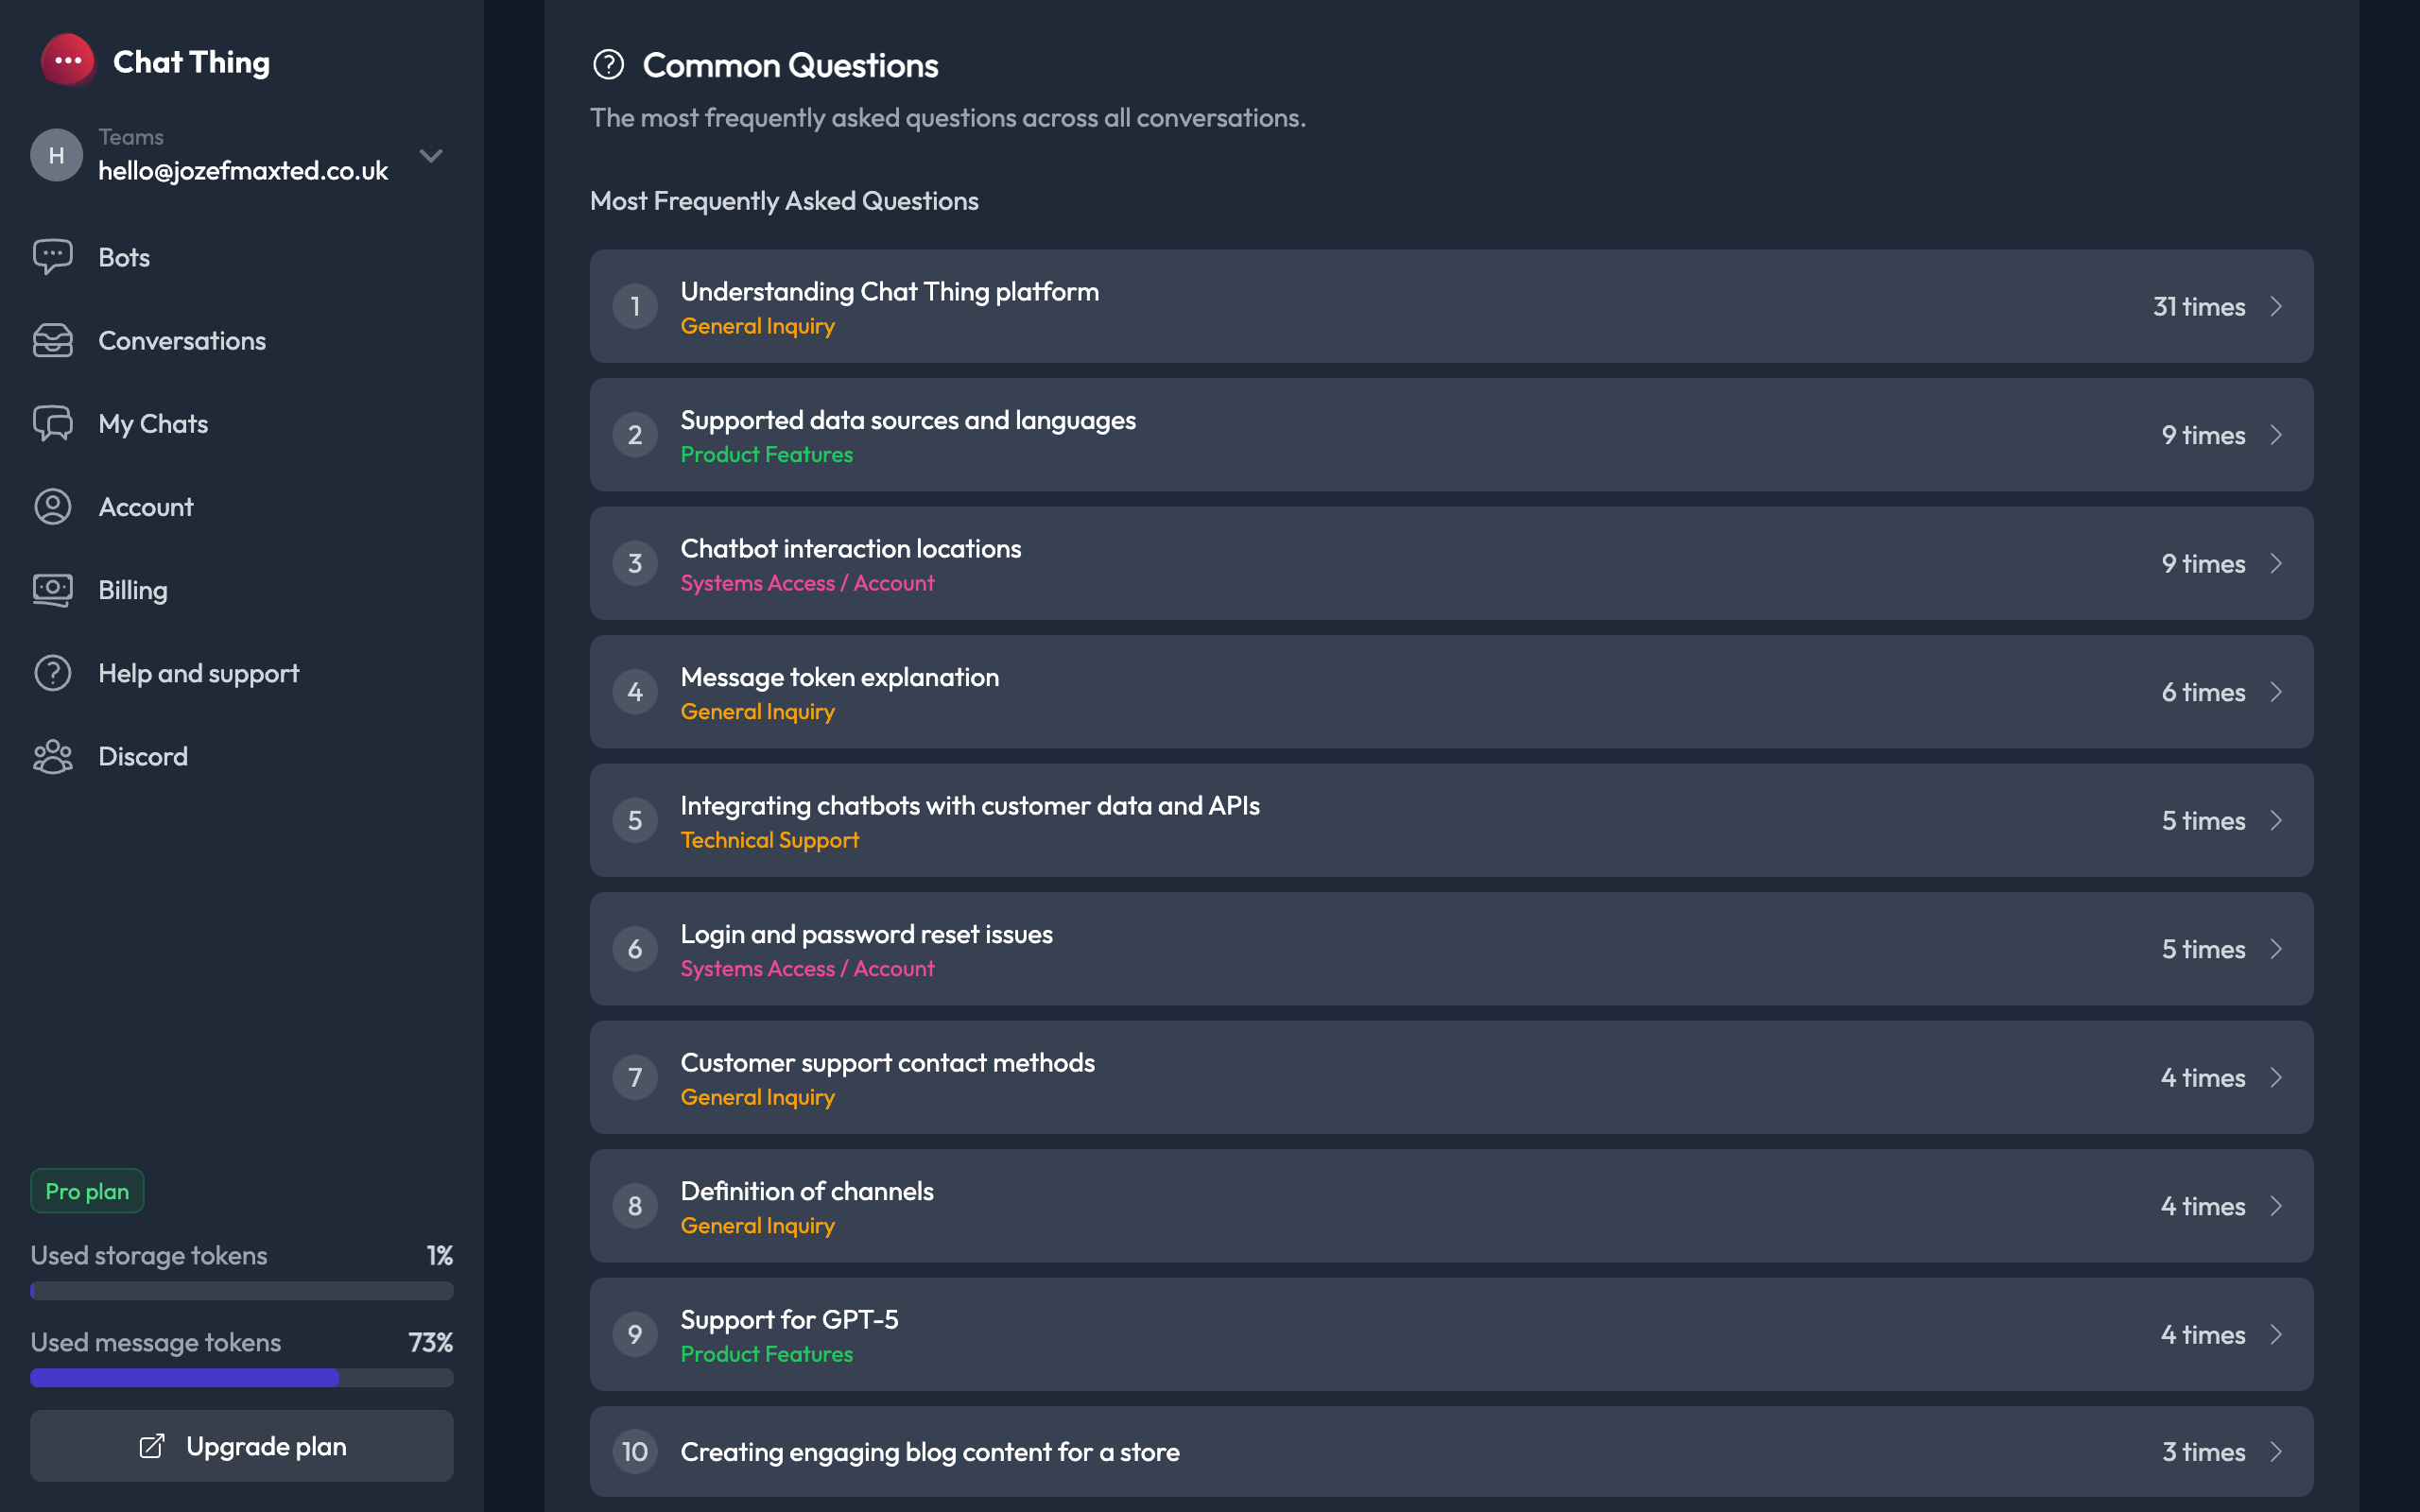
An AI clusters every question your users asked into the top ten things they actually wanted to know.
Each cluster has a topic tag, an ask-count, and an expandable view of the individual conversations behind it. This is where you find the article you should write next, the FAQ entry that's missing, the prompt instruction your agent needs.
Actionable Recommendations
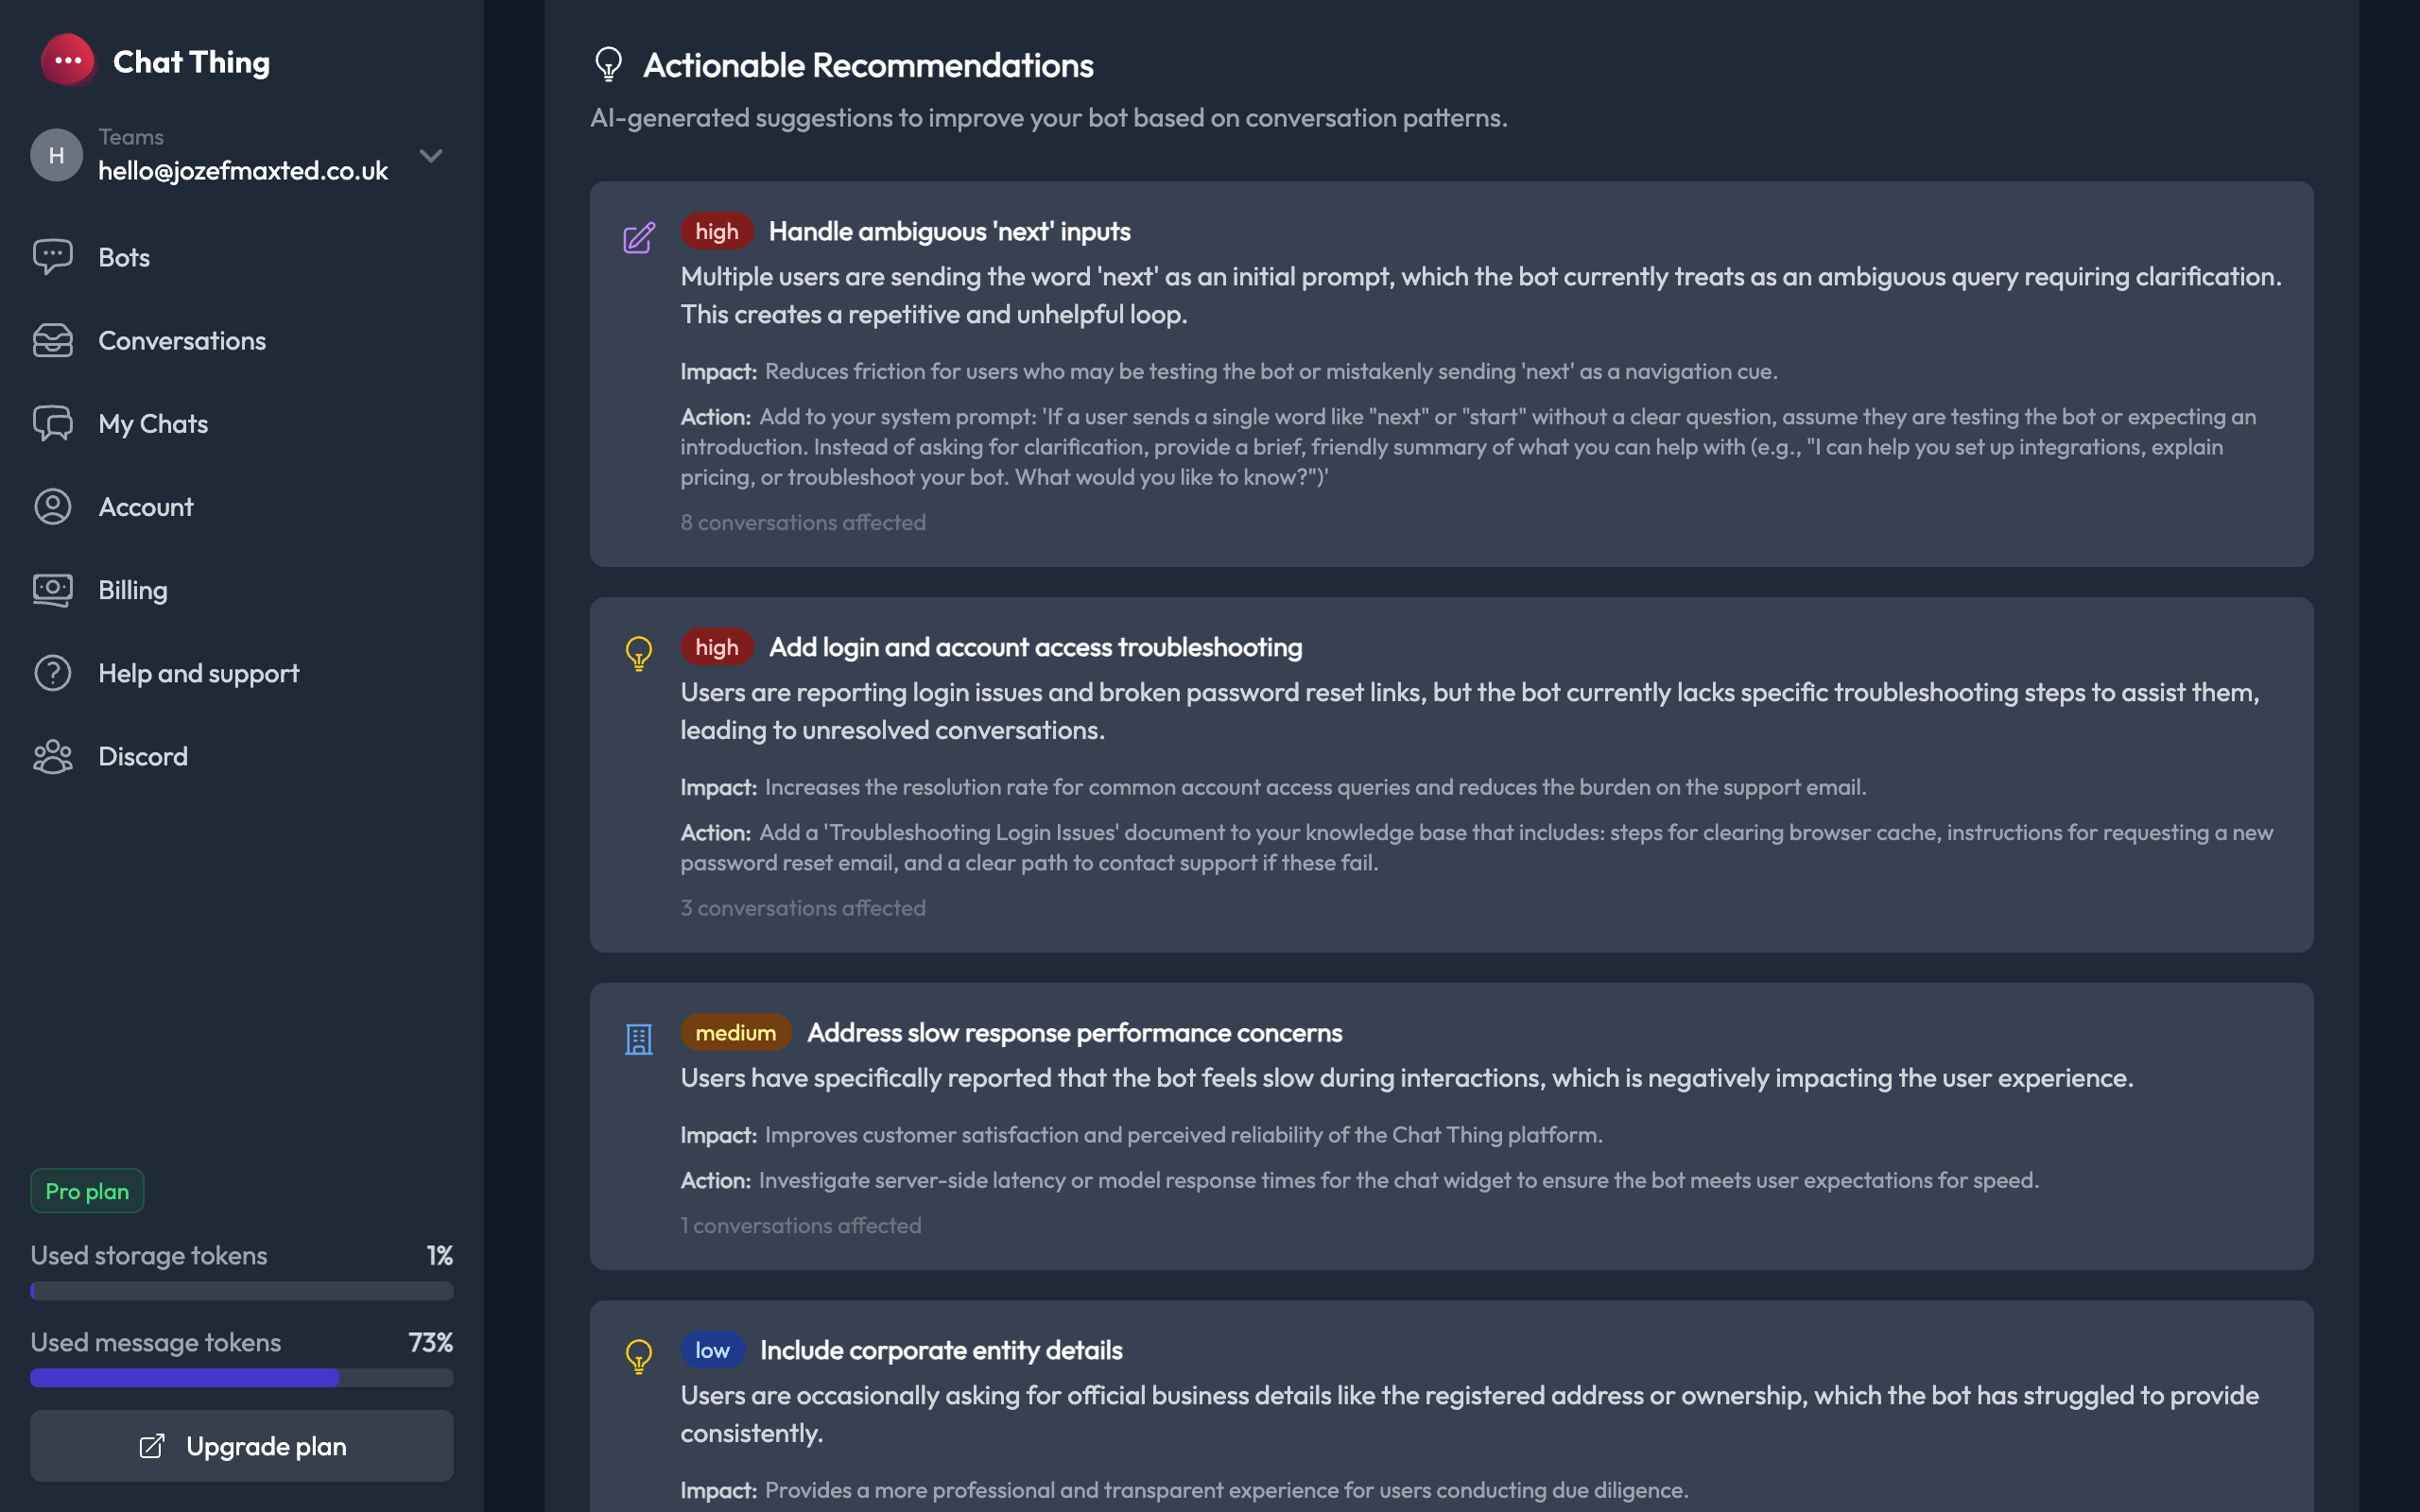
The dashboard generates specific suggestions ranked by priority. High, Medium, Low, Info.
Each recommendation has a type (Prompt Update, Knowledge Gap, Business Insight, Feature Suggestion, or Success), a description, an impact statement, action steps, and the count of conversations it affects. Some are about your agent. Others are about your business.
The for-sale-sign story came out of this section. The dashboard noticed the same complaint surfacing across many separate conversations, classified it as a Business Insight, and wrote a one-line action: take the signs down sooner, your customers are noticing.
It catches what you would miss
This is the bit we keep coming back to. The dashboard isn't only summarising agent performance. It's listening to what your customers are saying about the business behind the agent, and giving you a quiet nudge when something's off.
A delivery window that's frustrating people. A returns step that nobody can find. A booking flow that loses customers halfway through. A sign that's been up too long.
You don't need to know the question in advance. The dashboard finds it for you.
Weekly email digest
If you'd rather not open the dashboard at all, opt in to a weekly email with the headline metrics, sentiment overview, top questions, AI insights, and links straight back into the dashboard. Configurable per user in Account settings.
Why we built it this way
The data was always there. What was missing was someone to read it.
An LLM can read every conversation an agent had this month, cluster the themes, surface the friction, rank the priorities, and tell you what to do about it. So that's what the dashboard does.
Getting started
Live today on Pro and Enterprise plans.
Open any agent, click Overview, pick a month range. Topics, sentiment, engagement metrics, common questions, and recommendations all populate automatically.
Tomorrow: if your community runs on Discord, you'll want to be here.